买服务器上雨云
 由超大带宽雨云提供赞助
Warn
Crawlers need to be careful, do not use for illegal purposes.
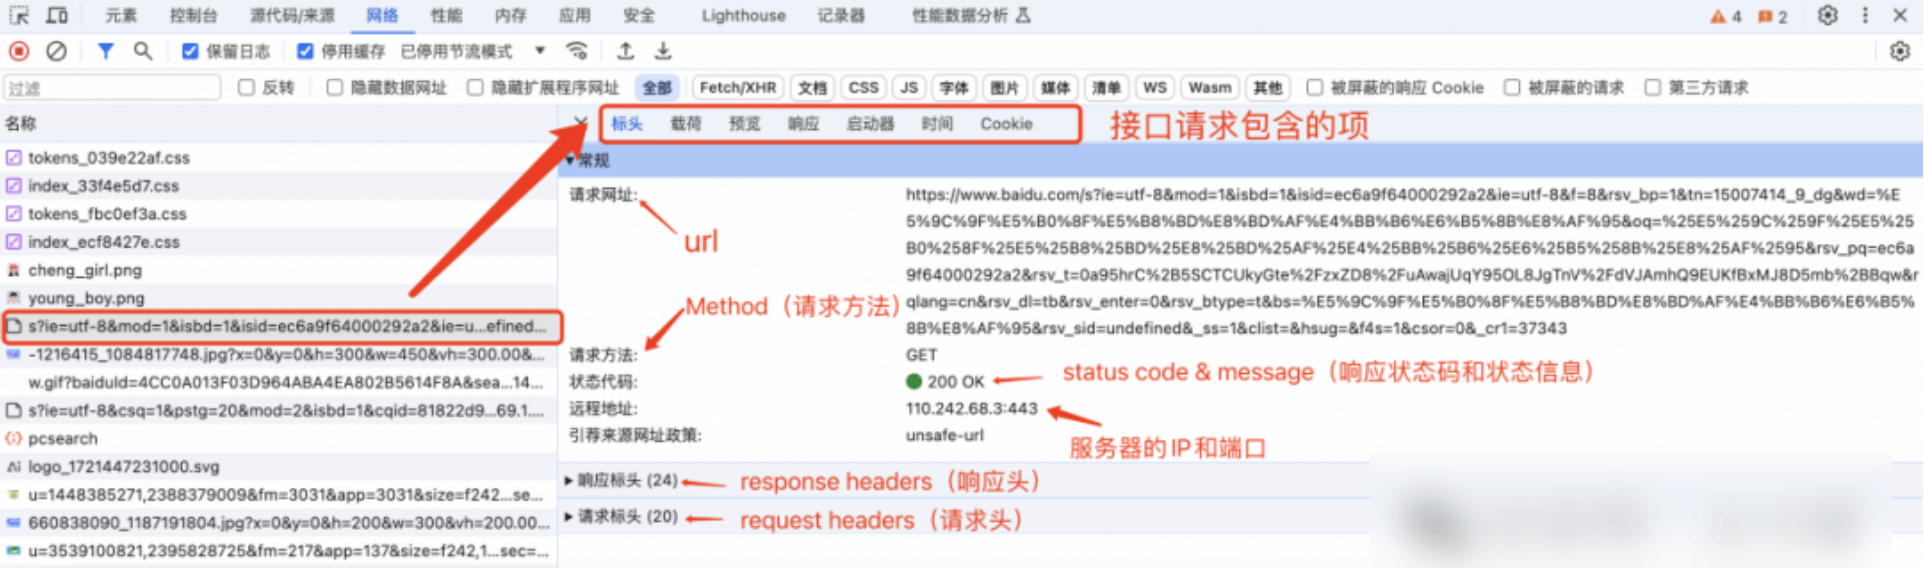
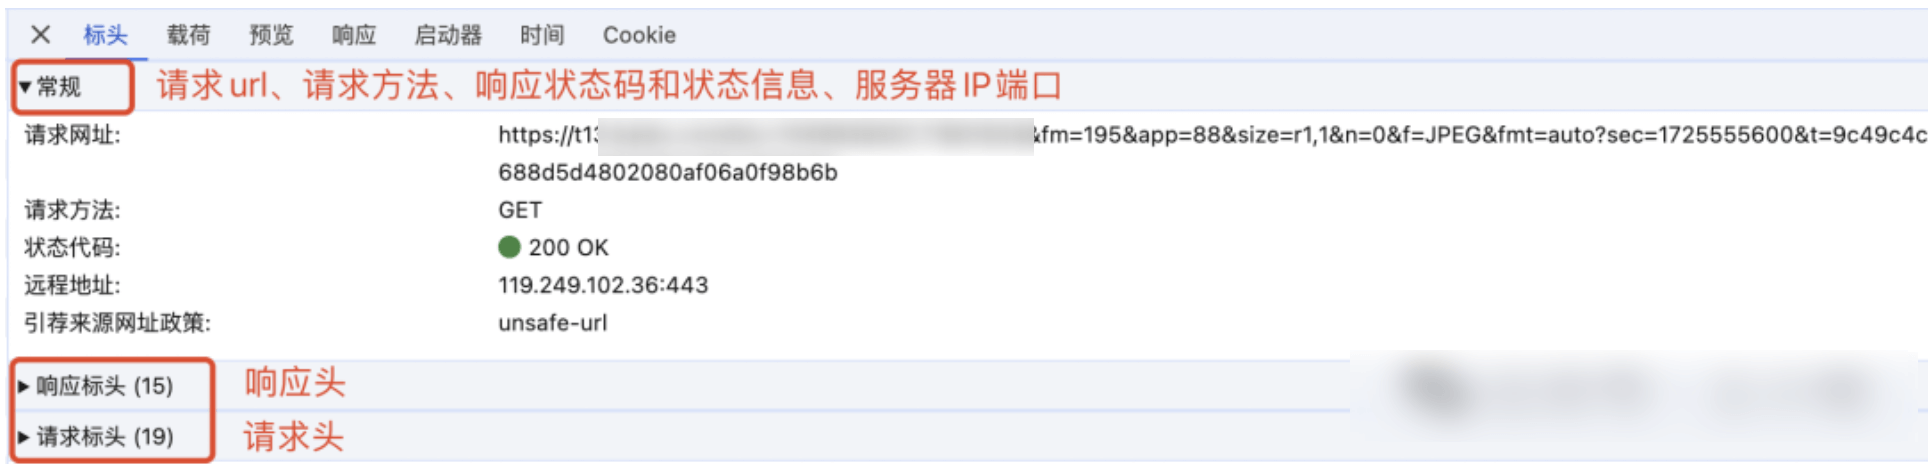
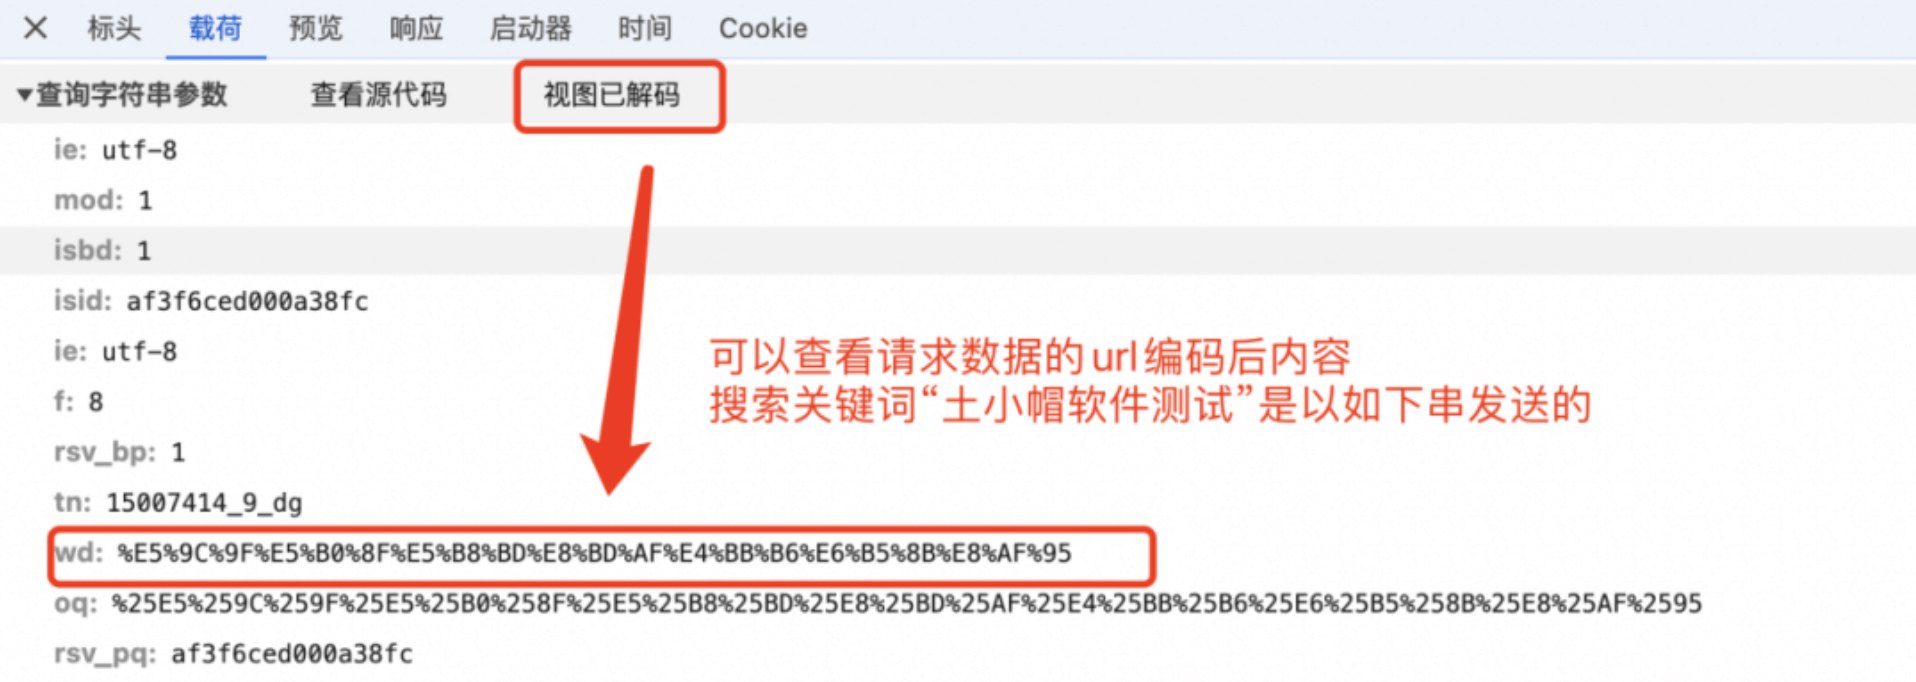
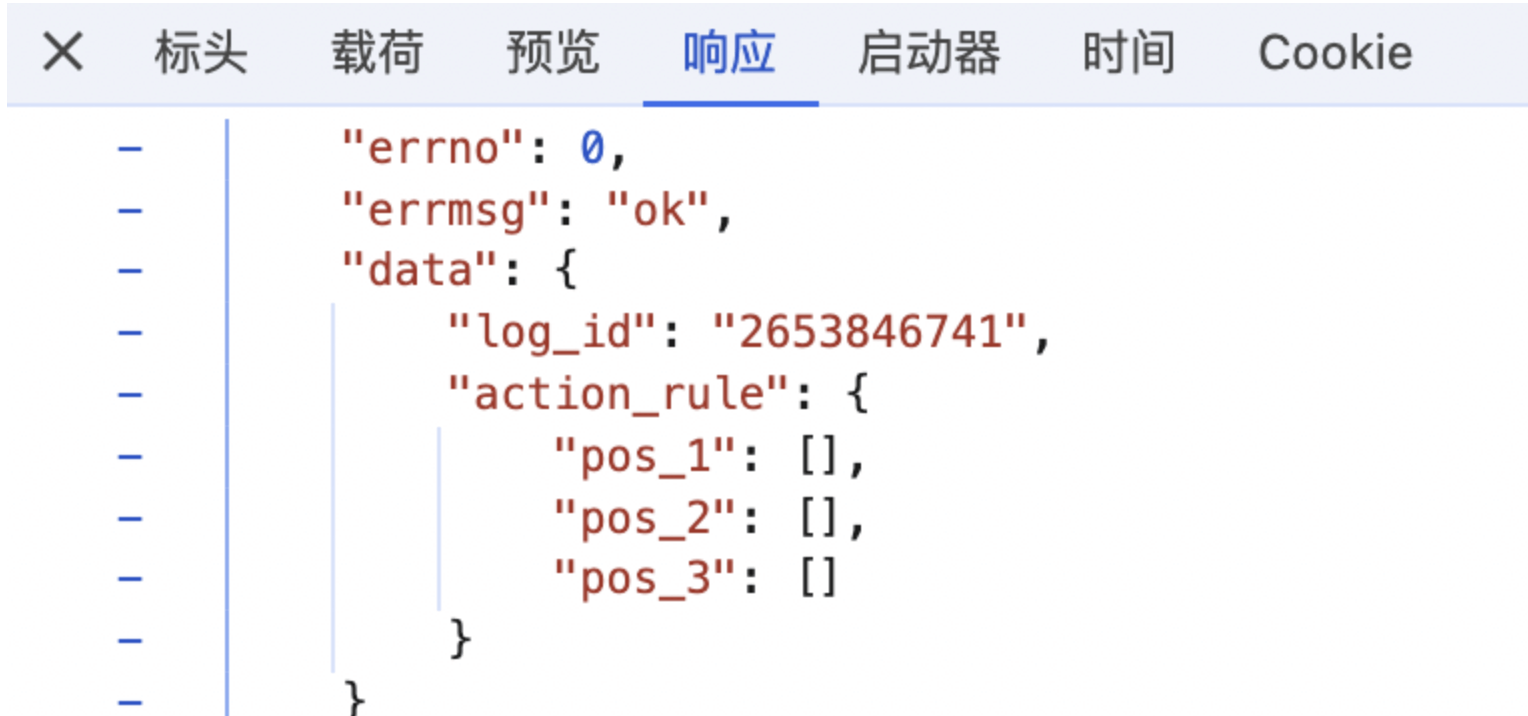
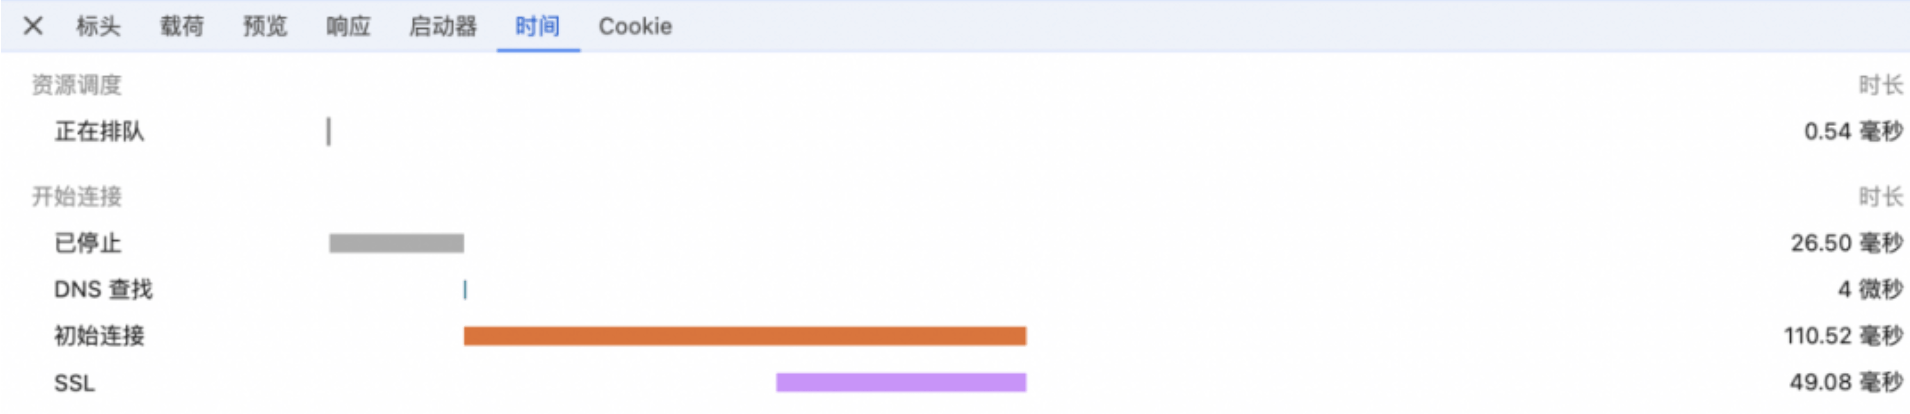
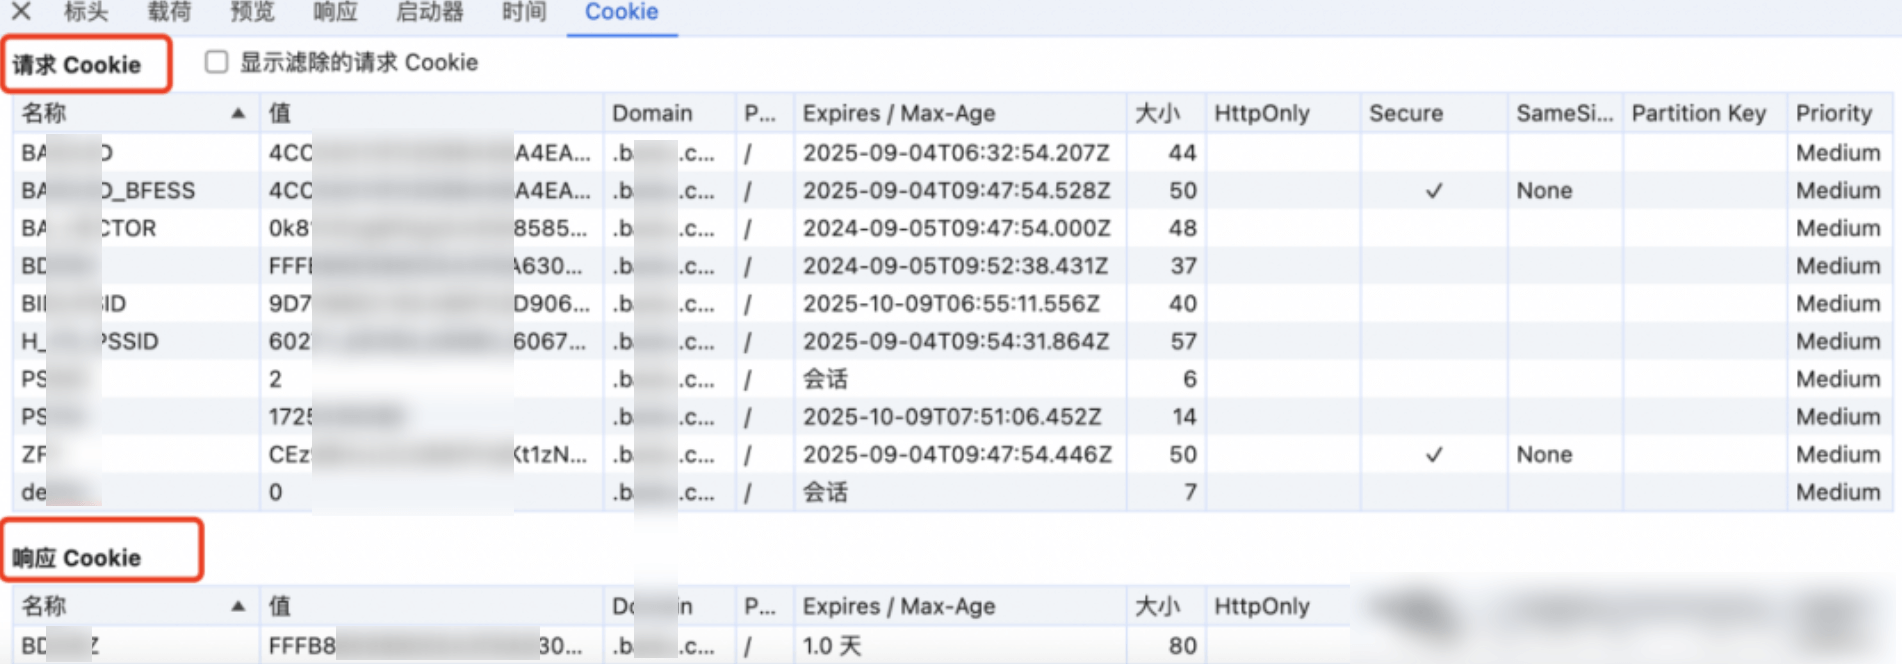
The request details field contains: Headers Payload Response Preview Initiator Timing Cookie.
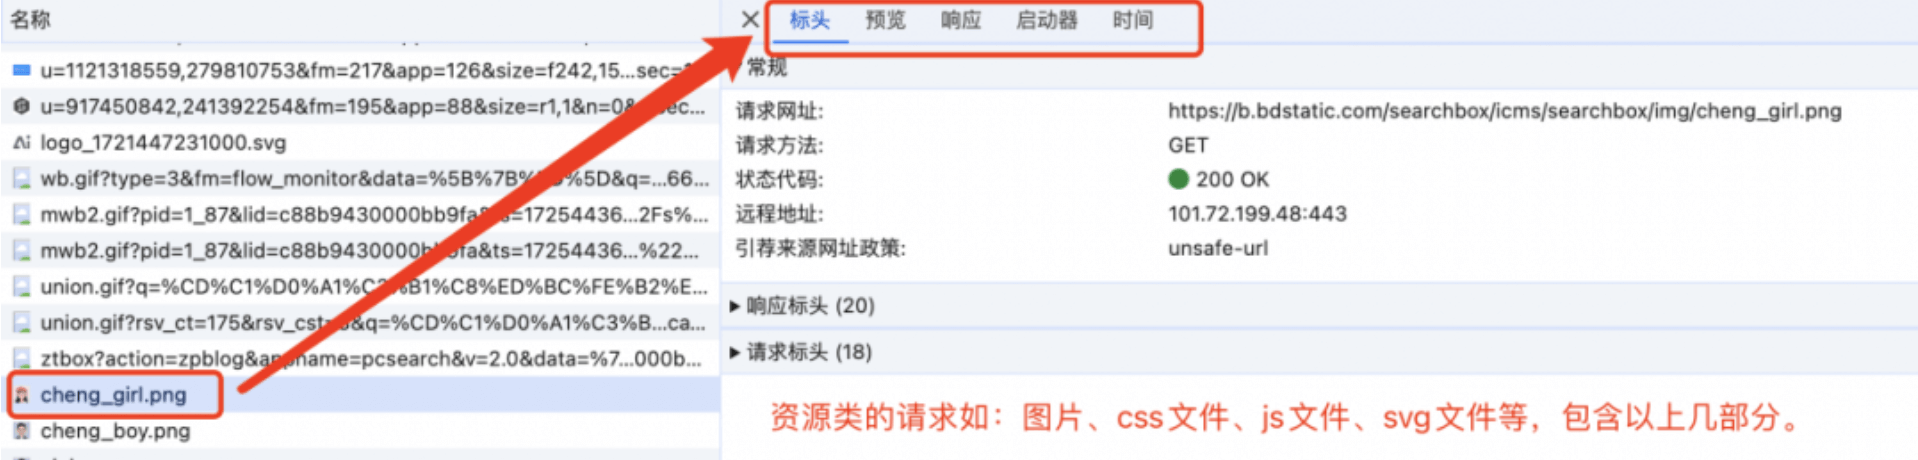
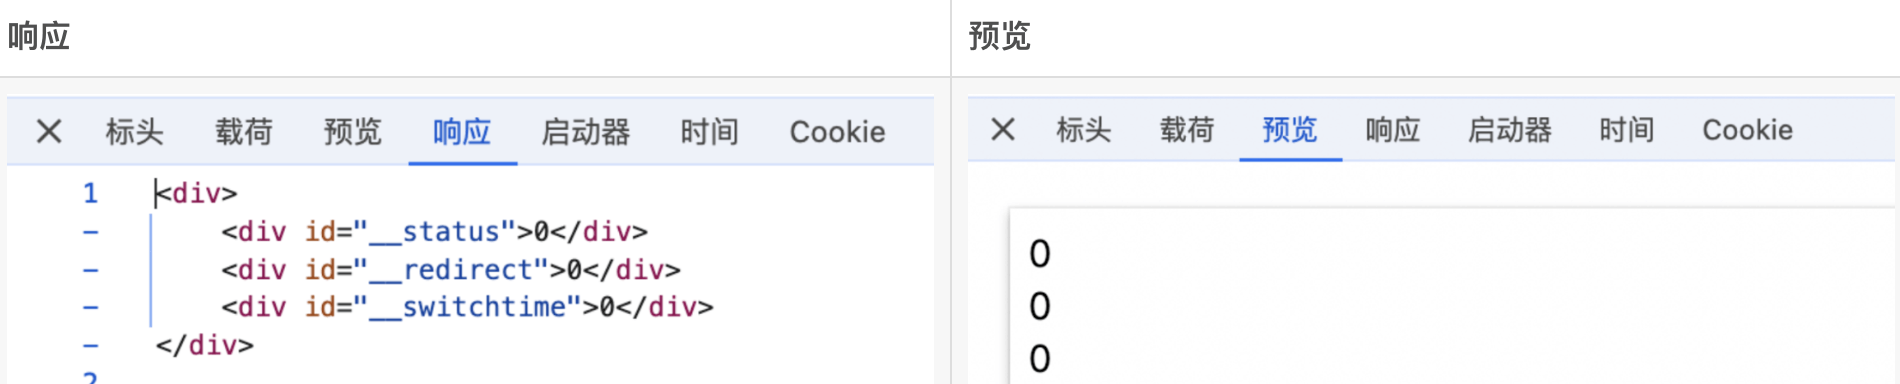
Such as: the return content is html tags, preview is parsed as html web page to display; return content is a resource class, may be the same as the two, such as css, js files are displayed file content.
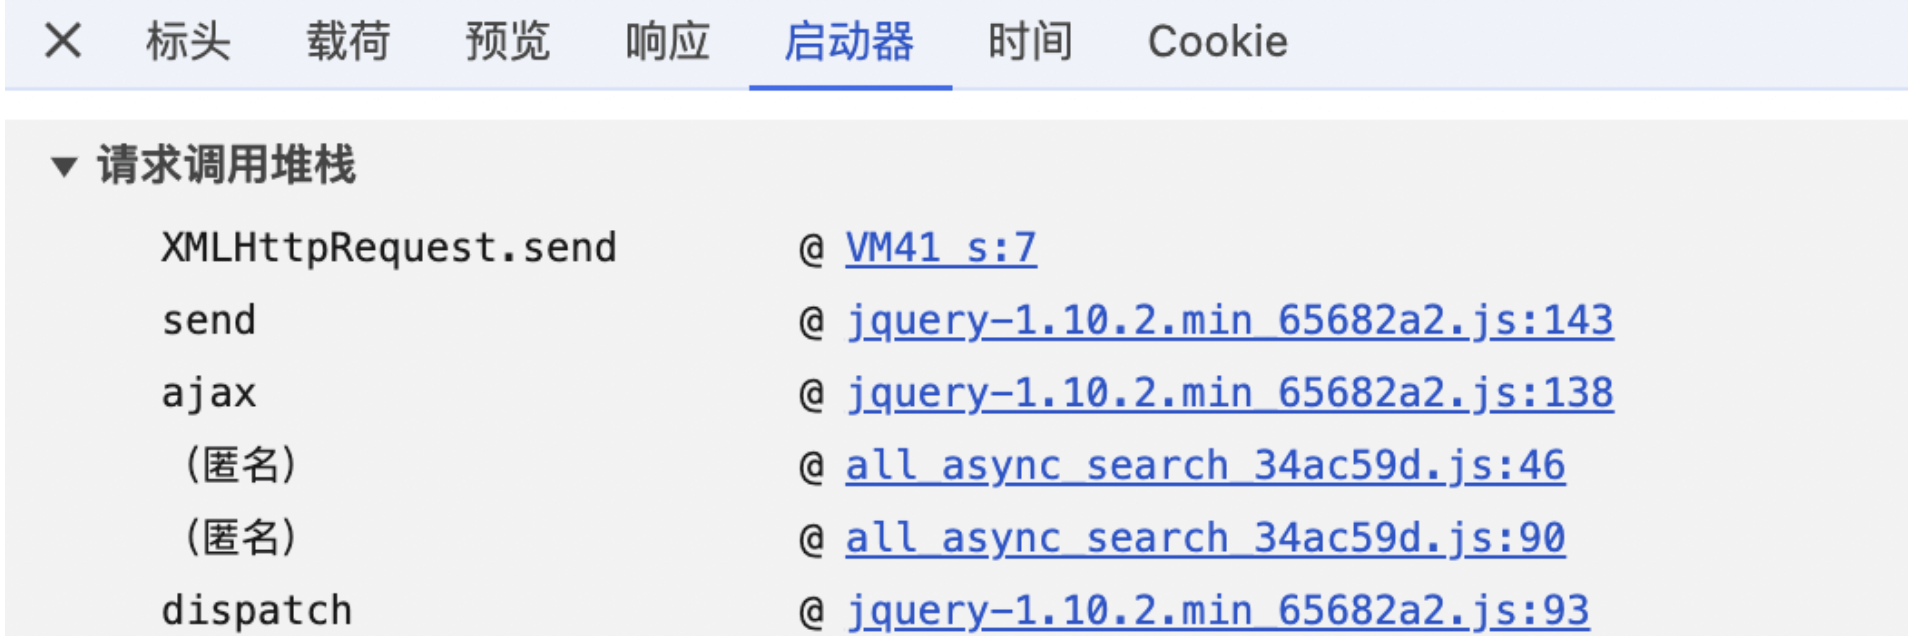
Generally used for anti-crawler code encryption parameters debugging.
Generally don't care.
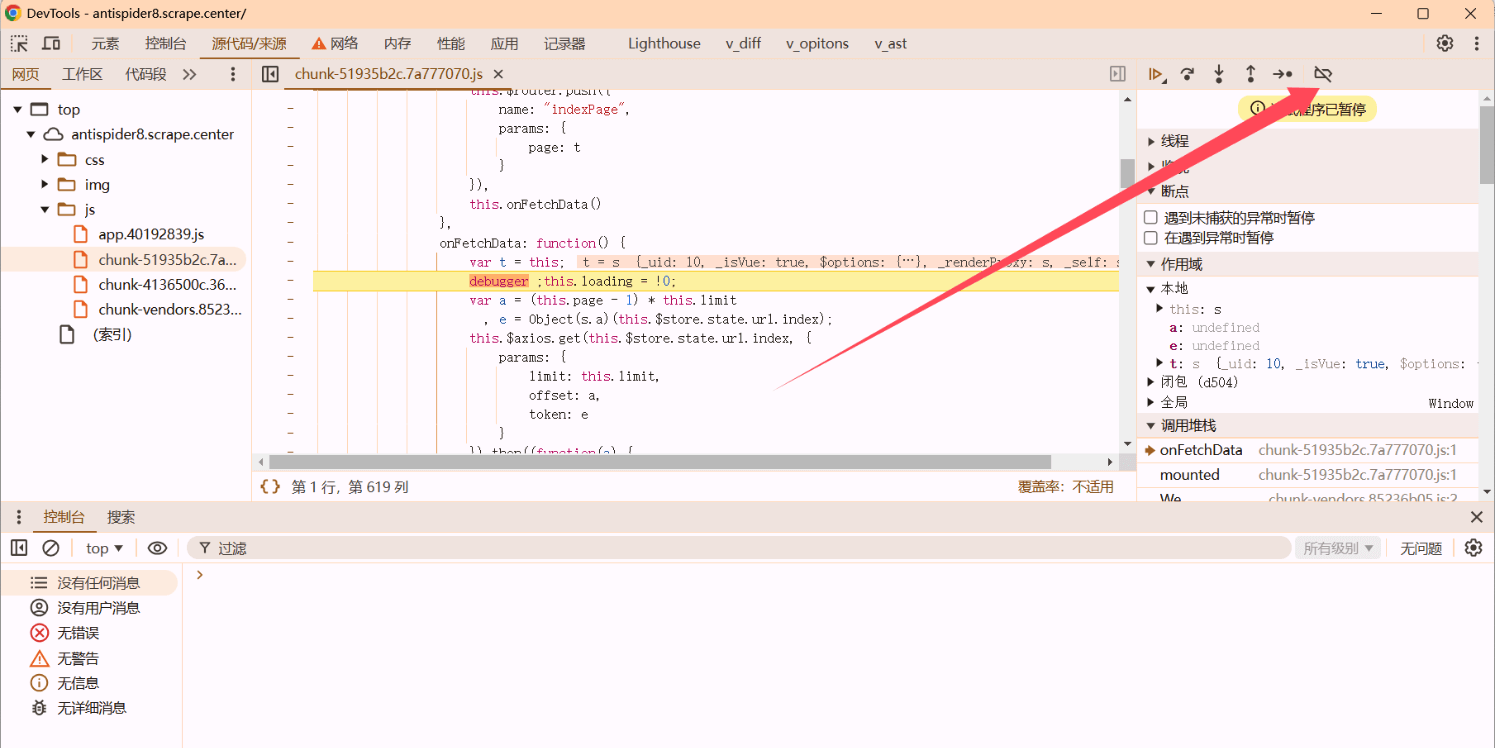
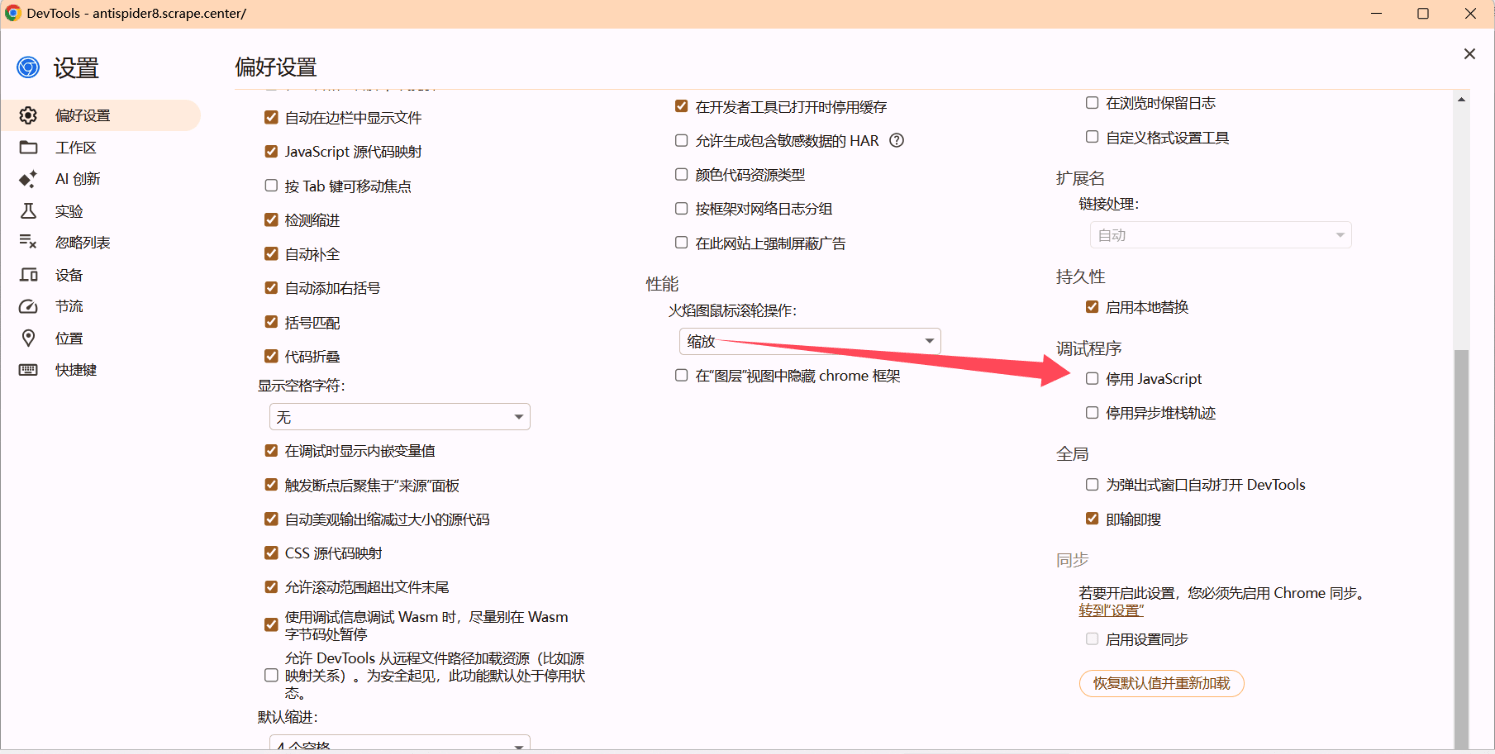
Anomaly ParametersOcr RecognitionBrowser fingerprintingAutomation techniquesTo the web page to view the page when the network request found that the page into the debugger mode, continue to execute down, loop into the breakpoint debugging.
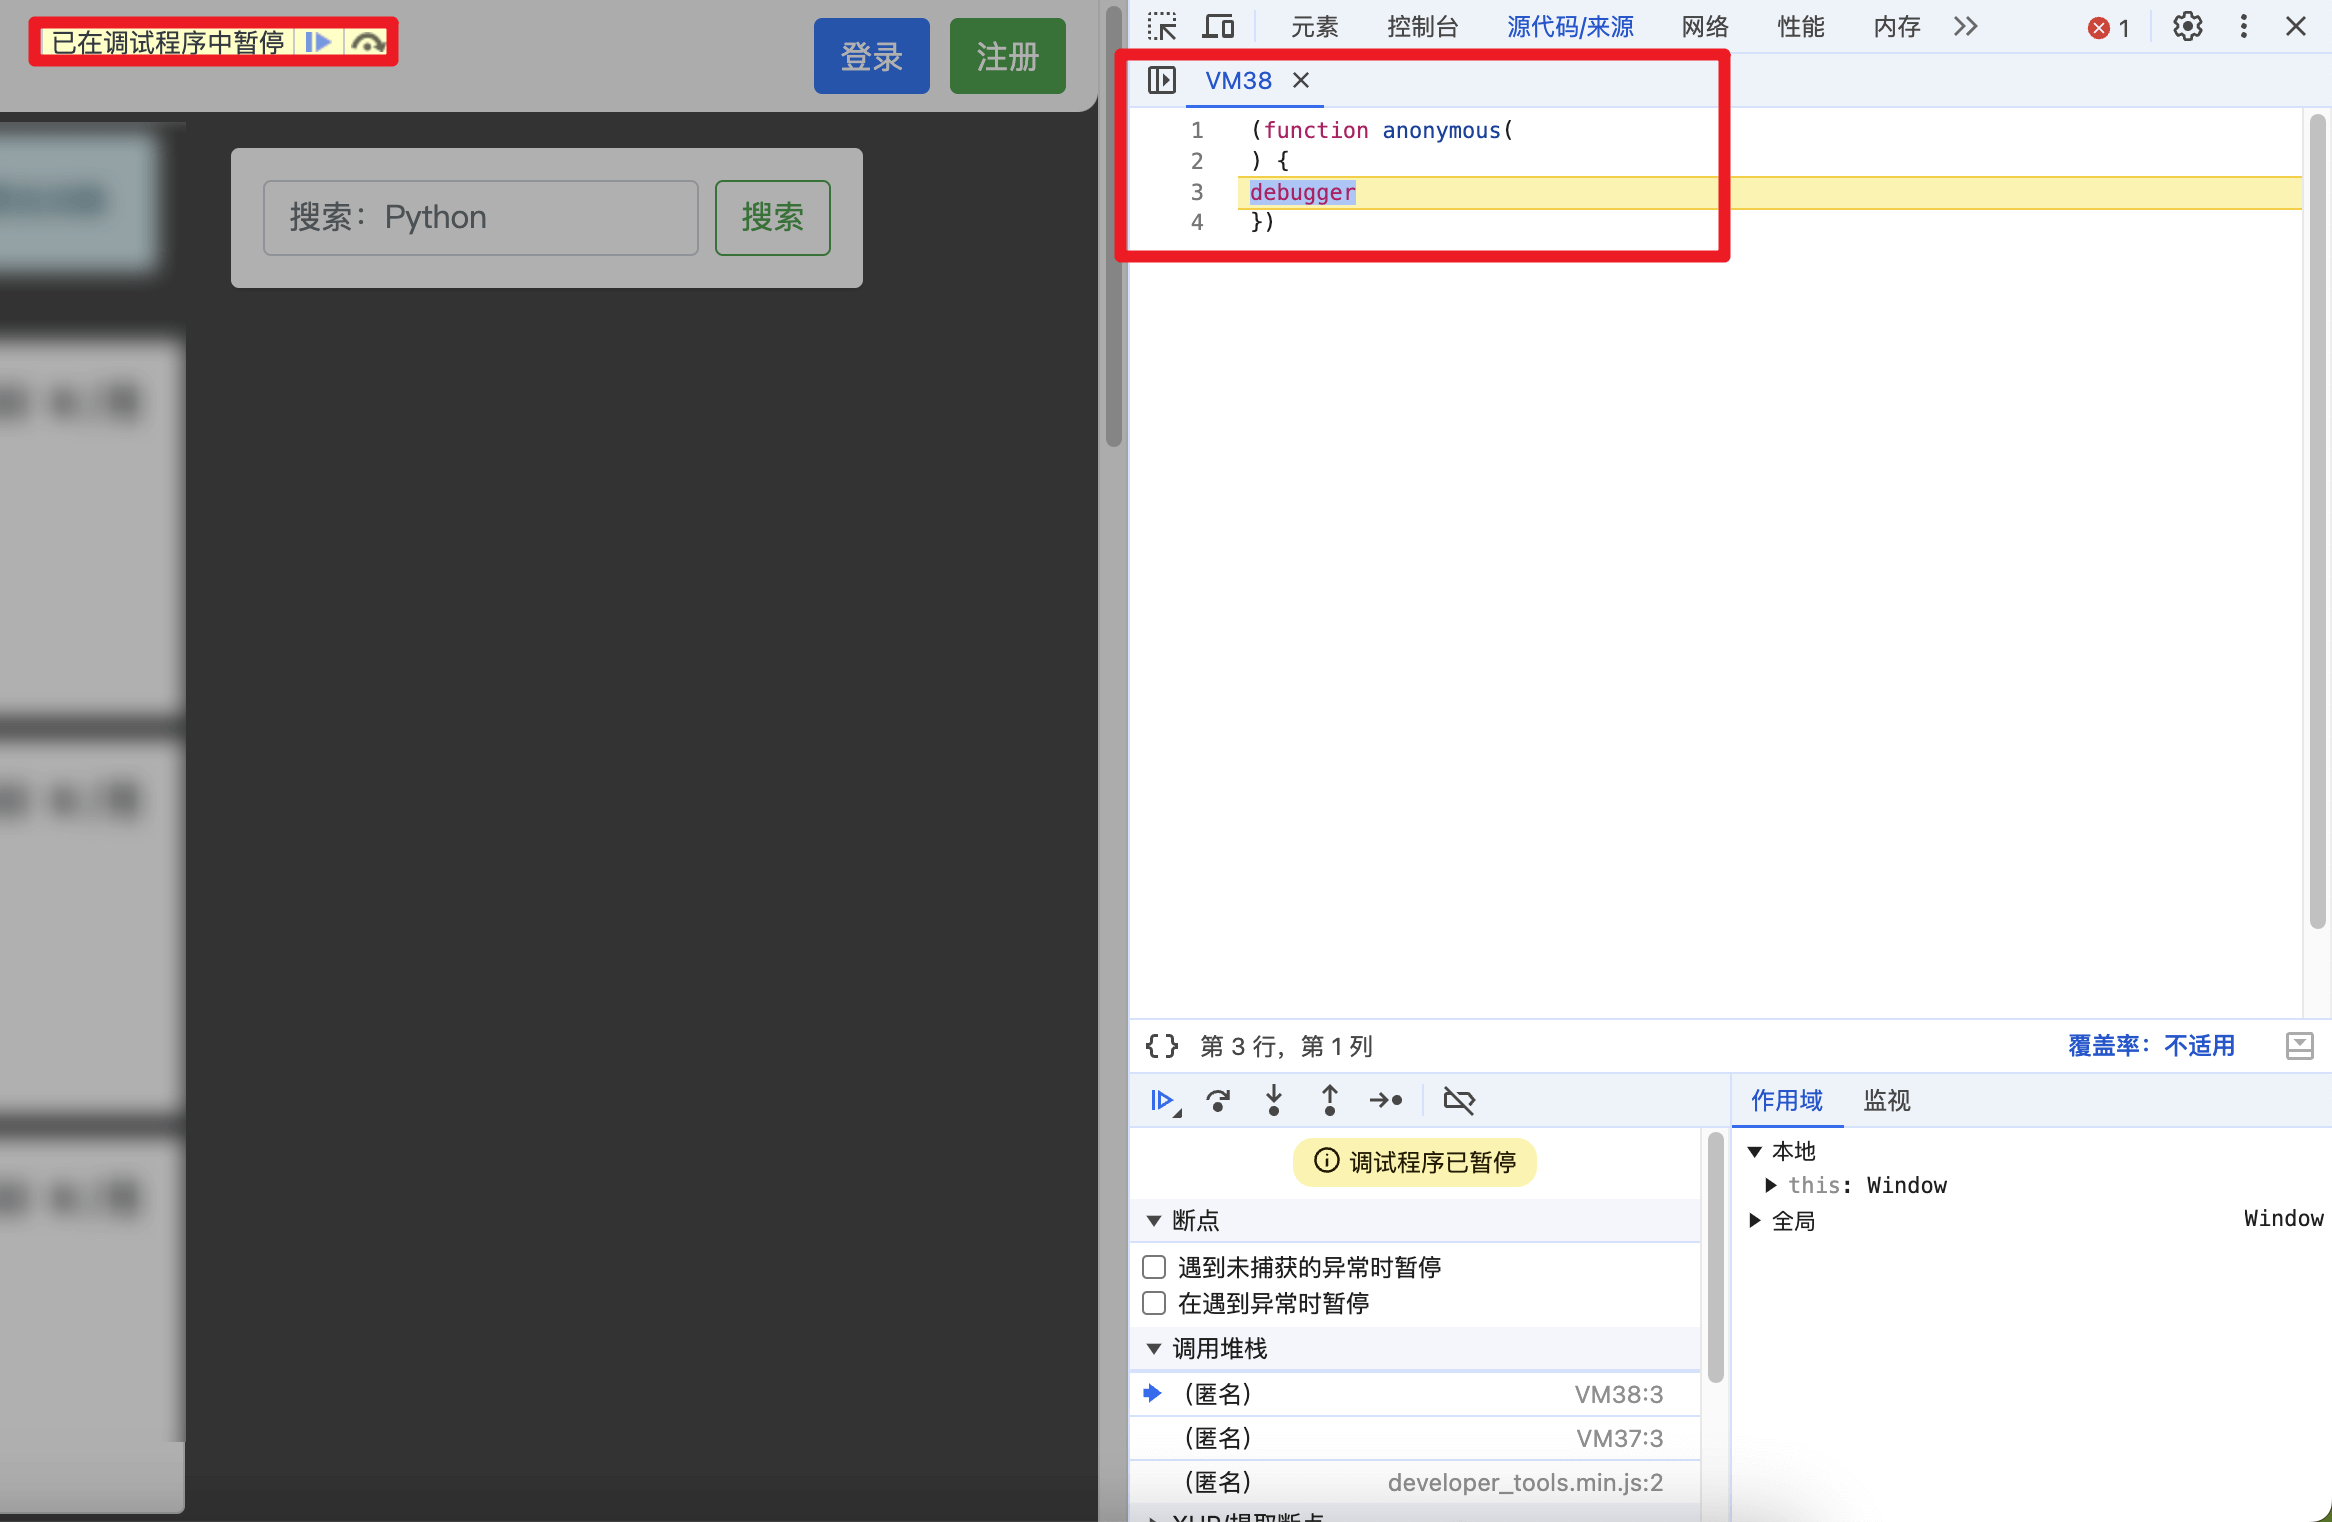
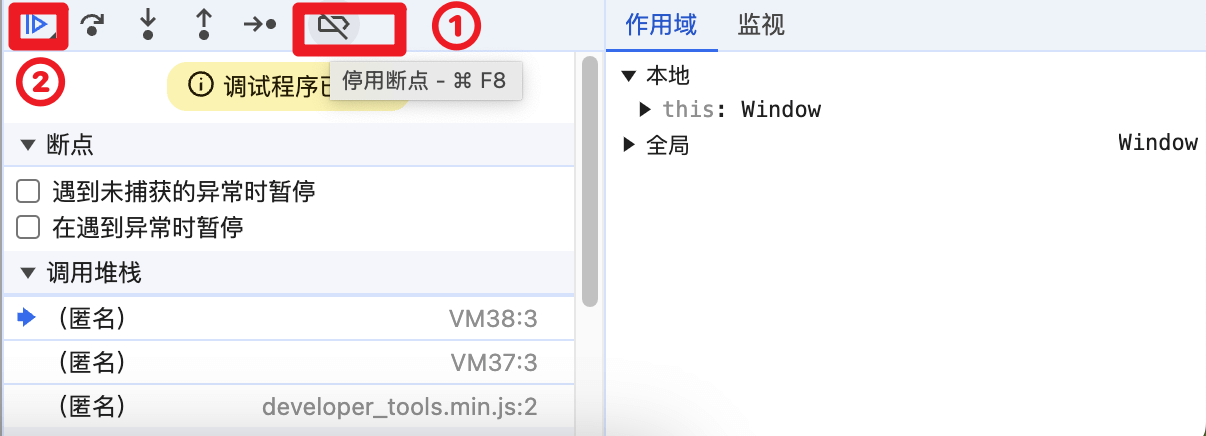
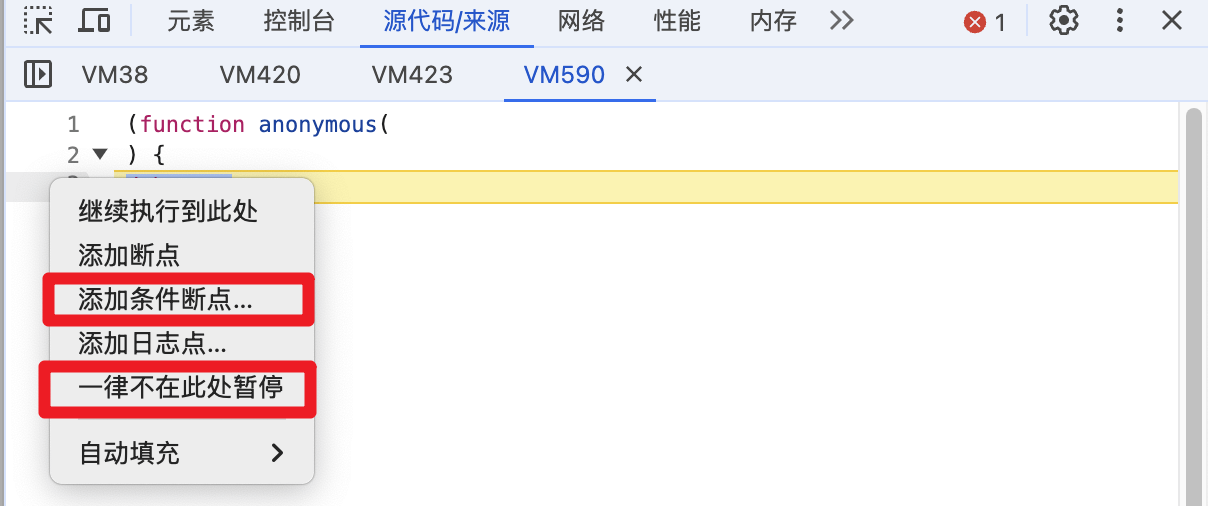
Disable breakpoints first (click to turn blue) -> continue to next step (click to turn ⏸).
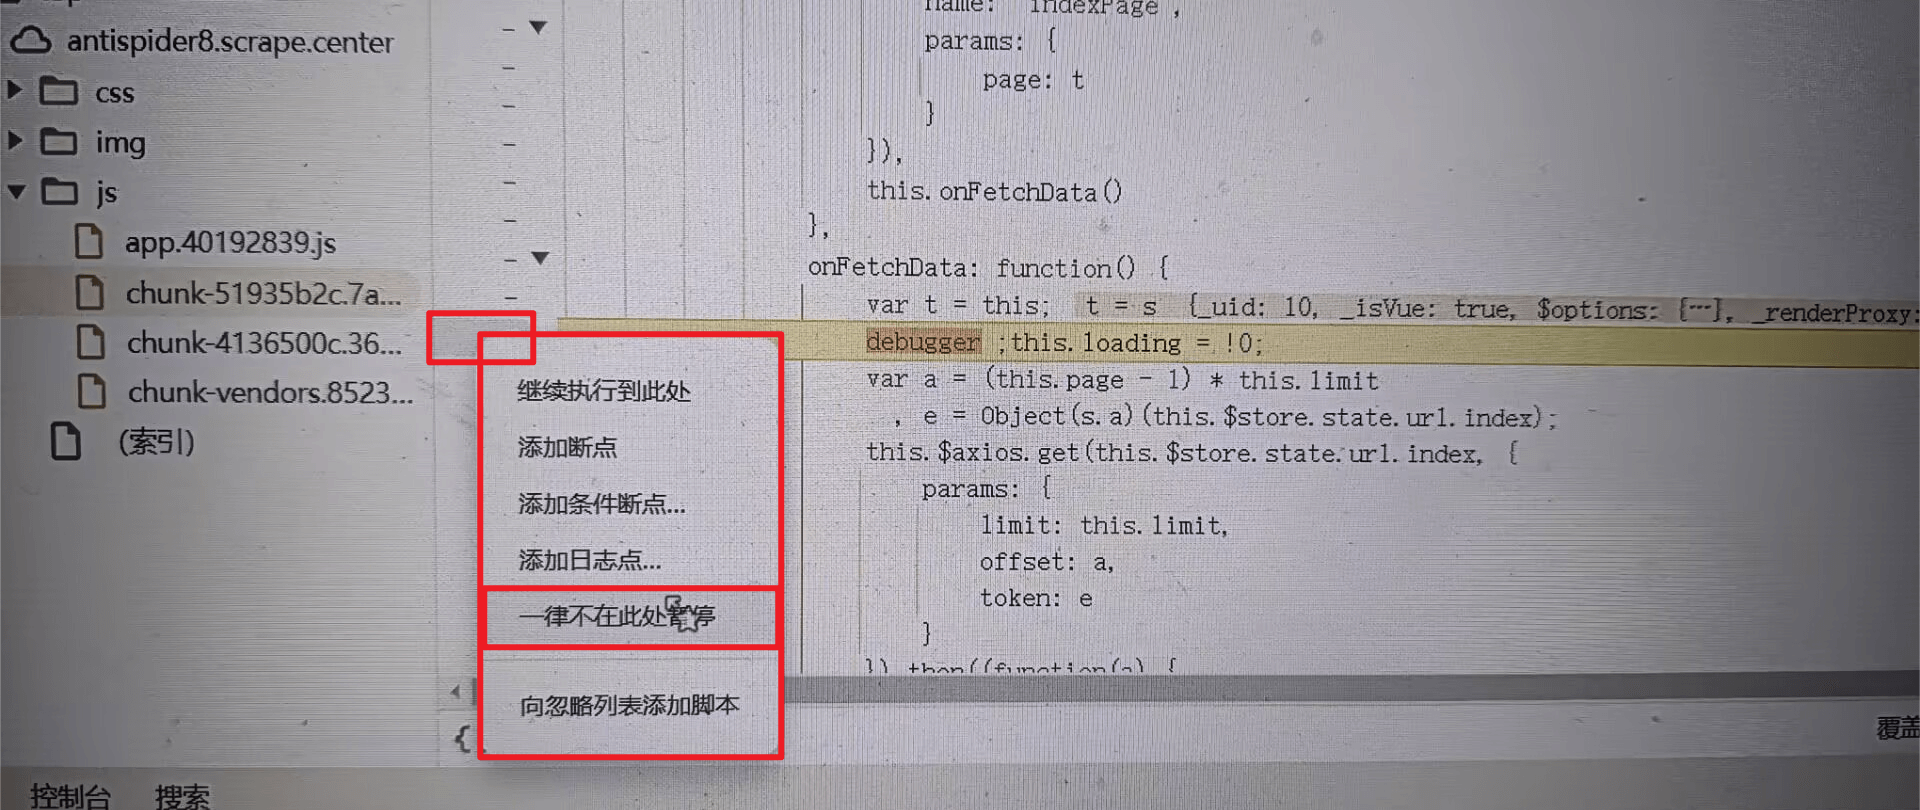
Right-click at the top of the breakpoint code and select Never pause here or Add conditional short point (advanced usage), Become ? symbol.
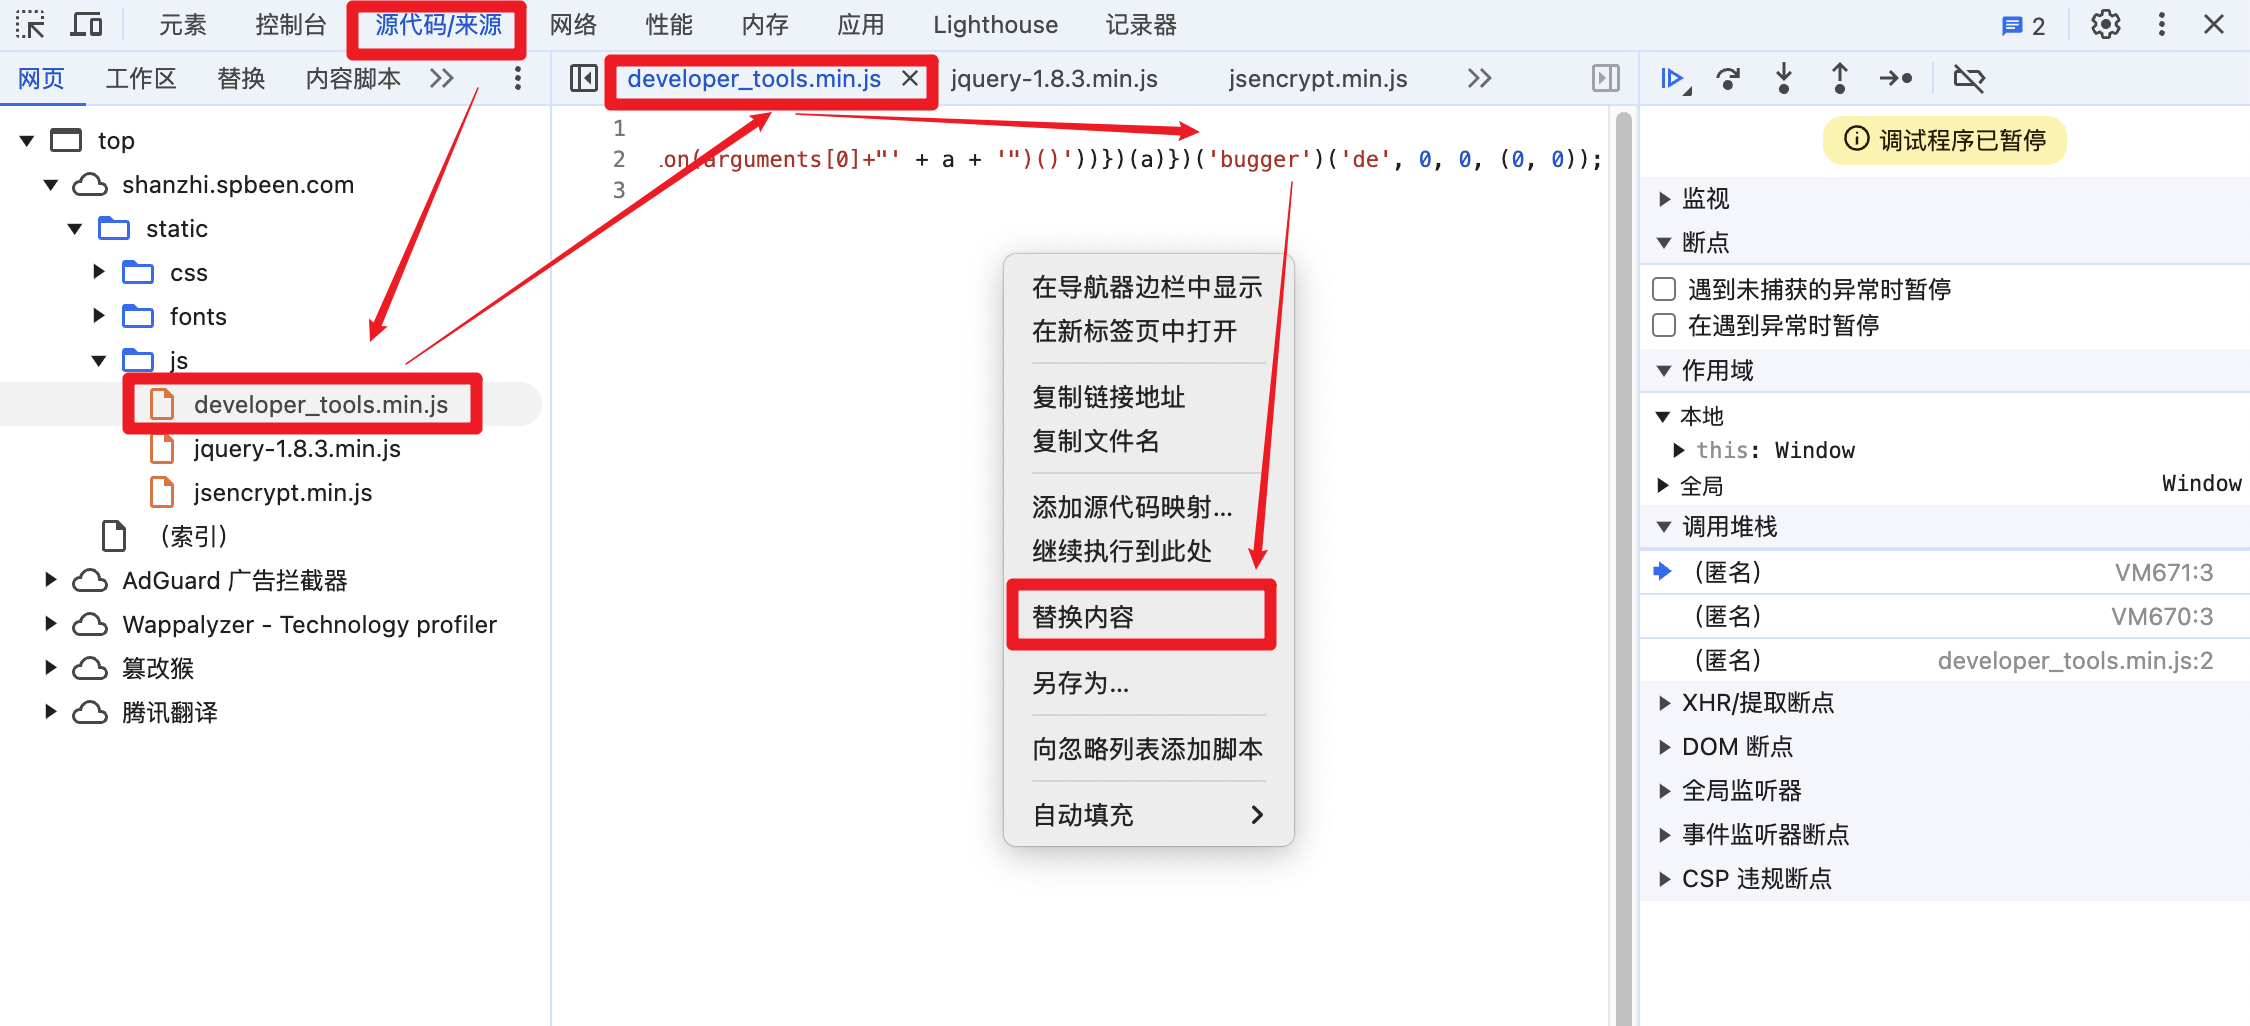
Find the original file, find the corresponding code, Replace the file after deleting the debugger related logic (here you can delete the contents of the setInterval timer).
Be sure to do this before the debugger enters (
tip you can set the network request to low 4g or 3g | or add the code in the first js file loaded)
// This is business code that has nothing to do with setInterval, so just leave it empty.
setInterval = function(){}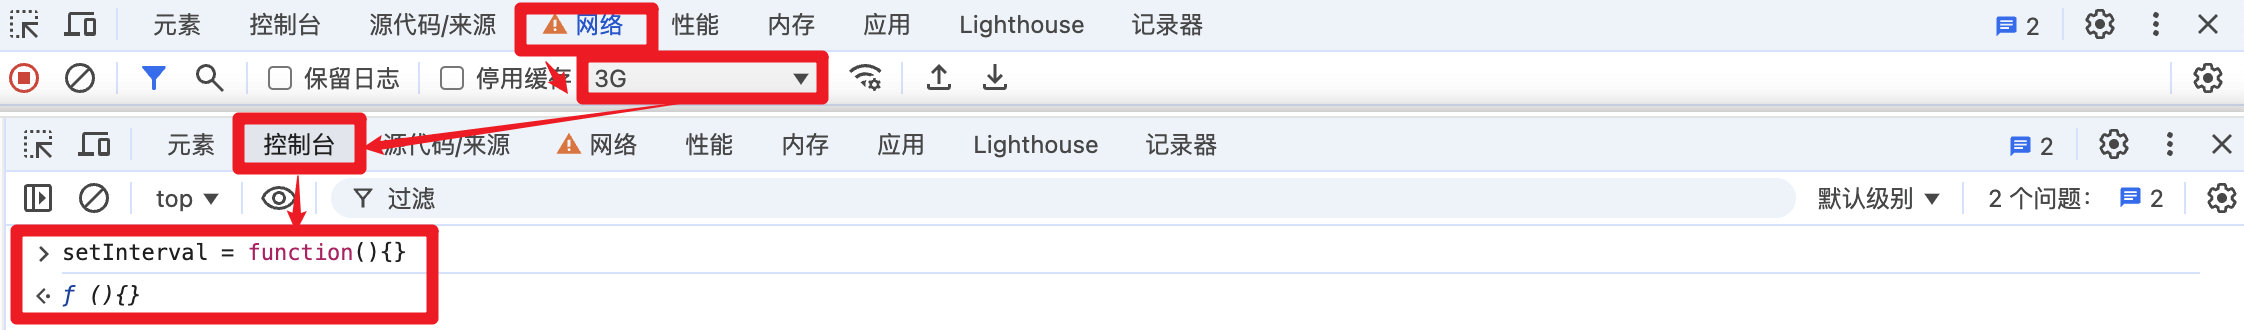
Be sure to do this before the debugger enters (
tip you can set the network request to low 4g or 3g | or add the code in the first js file loaded)
const _setInterval = setInterval;  // The original setInterval function is preserved
setInterval = function (a,b) {
    if (a.toString().indexOf('debugger') == -1) {
        return function() {}; // If 'debugger' is not included, an empty function is returned, which means that no action will be performed.
    } else {
        _setInterval(a,b);  // If 'debugger' is included, the original _setInterval function is used to set the timer.
    }
}

// The overridden method returns a string
Function.prototype.toString = function () {
    return `function ${this.name}() { [native code] }`
}
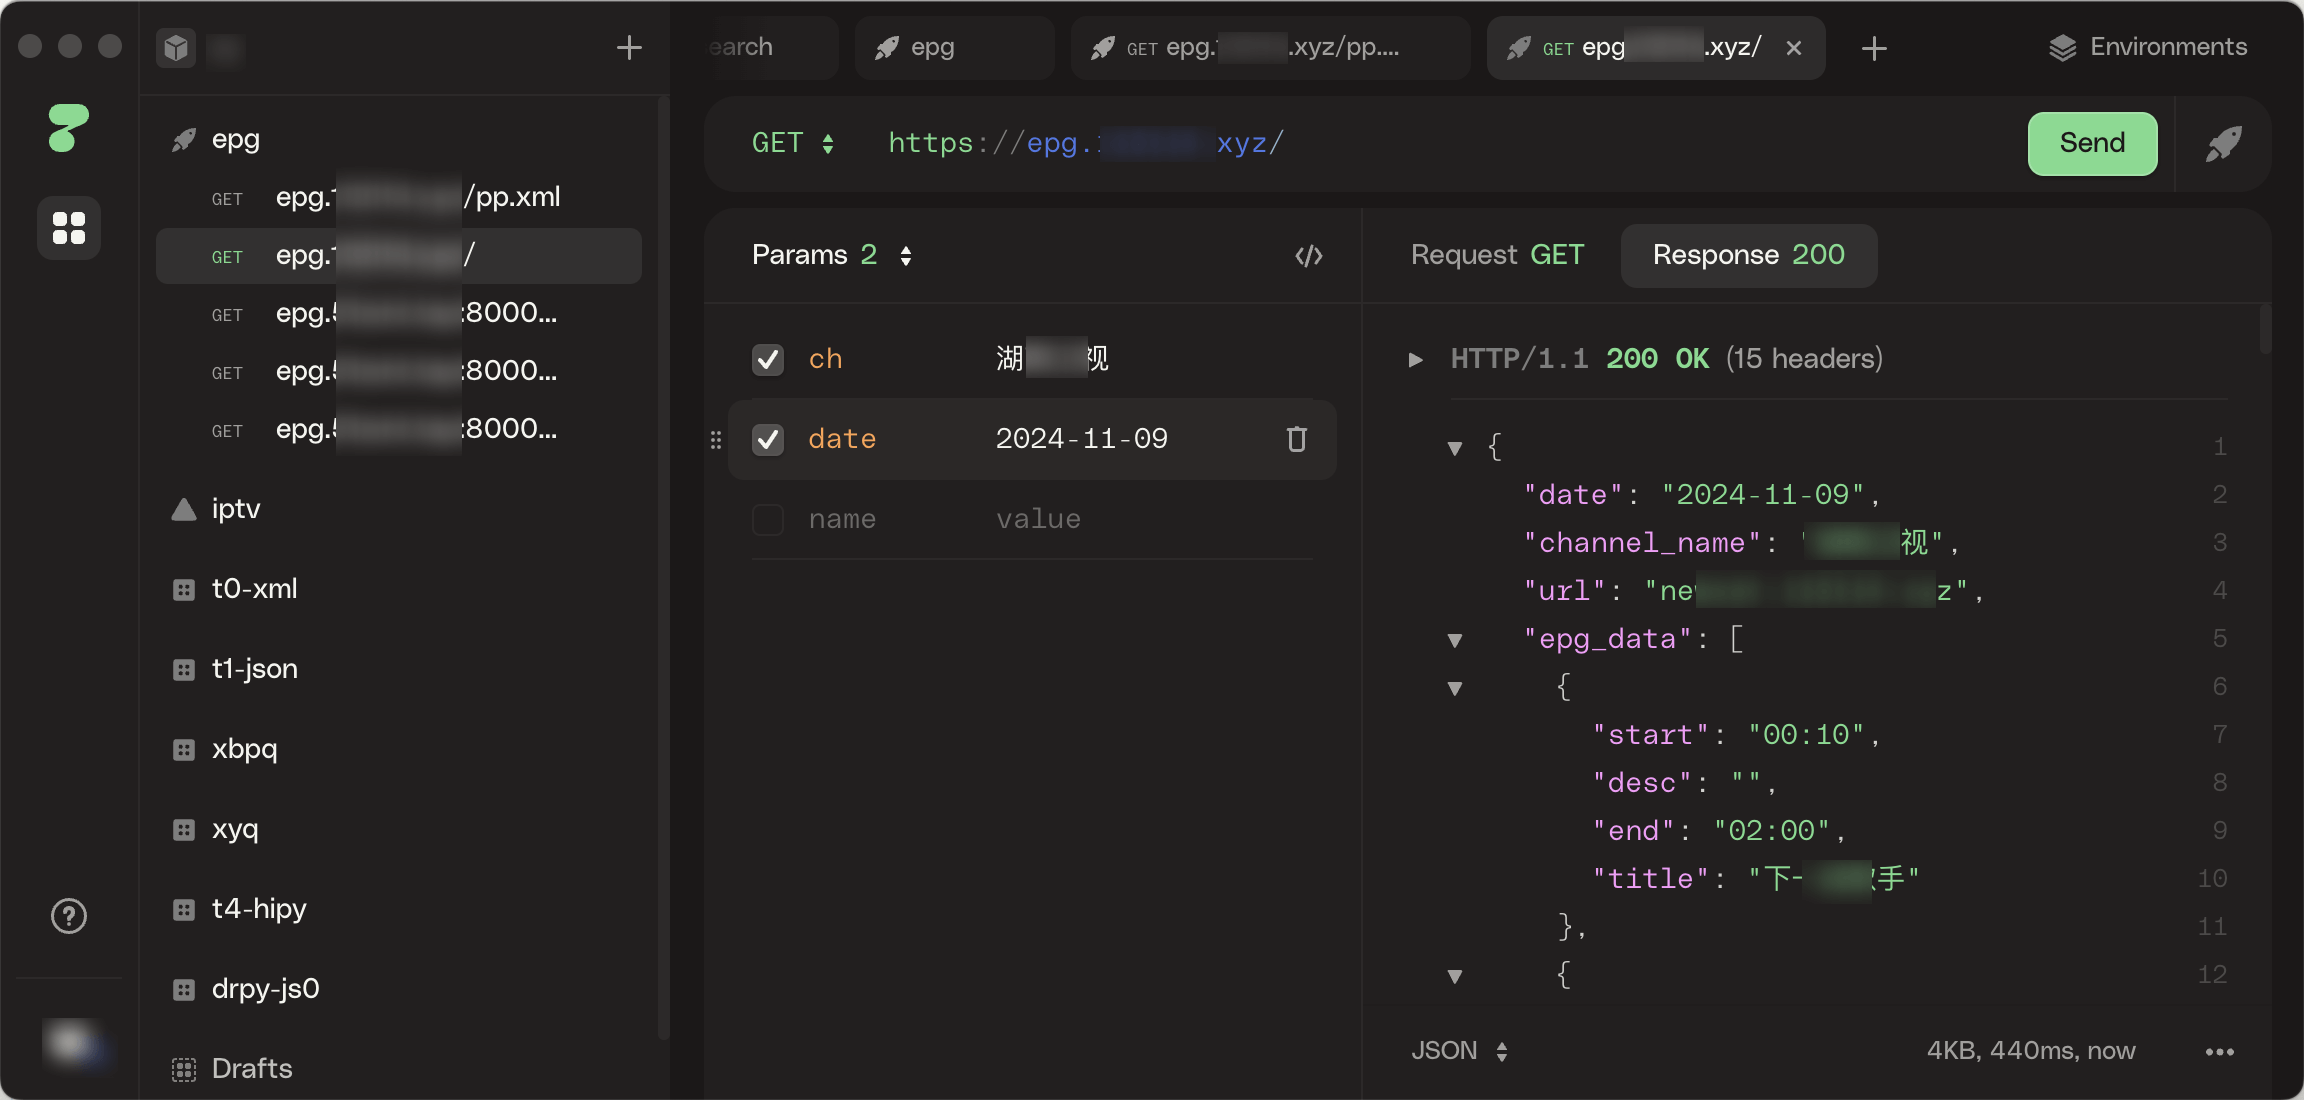
Common Tools: postman apifox httpie
Tool to quickly send requests, facilitate debugging, and verify that data parameters are correct.
qiuqiuauthor share (authorized), the following content is only for the record and learn the knowledge of reptiles, prohibit commercial use.
document.onkeydown = function () {
    var e = window.event || arguments[0];
    if (e.keyCode == 123) {
        return false;
        return true;
    }
}devtoolsDetector.addListener(function(isOpen) {
if(isOpen&&!Rain){
self.location.href="https://baidu.com";
}
});window.onbeforeunload = function () {
debugger
}eval(atob('ZGVidWdnZXI='))replace debugger keyword(function() {
var _eval = window.eval;
window.eval = function(x) {
_eval(x.replace("debugger;"," ; "));
}; // Bypass debugger
window.eval.toString = _eval.toString; // Anti-debugger detection
})();rewrite debugger functionAAA = Function.prototype.constructor;
Function.prototype.constructor = function (a) {
if (a == "debugger") {
return function () {};
}
return AAA(a);
}
Some sites may have multiple breakpoints requiring multiple operations.
setInterval((function() {
    debugger ;console.log("debugger")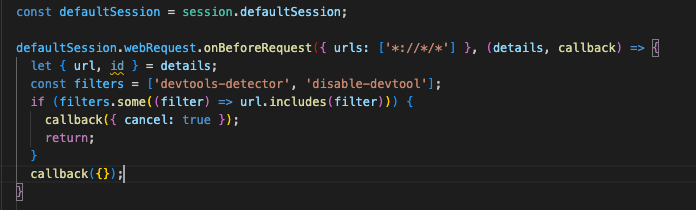
}), 1e3)Recognize the debugger reset function, other normal response timerslet _setInterval = setInterval
setInterval = function(a, b) {
if (a.toString().indexOf('debugger')== -1) {
return null;
}
_setInterval(a, b)
}