买服务器上雨云
 由超大带宽雨云提供赞助
With the help of the tools
Event Viewerandgflags(requires WinDbg).
gflags Microsoft's official instructions
x64 arch refer to this tutorial-This version of the method is as follows
Microsoft Store to install, click here to downloadPowerShell to enter the commandwinget install Microsoft.WinDbginfo
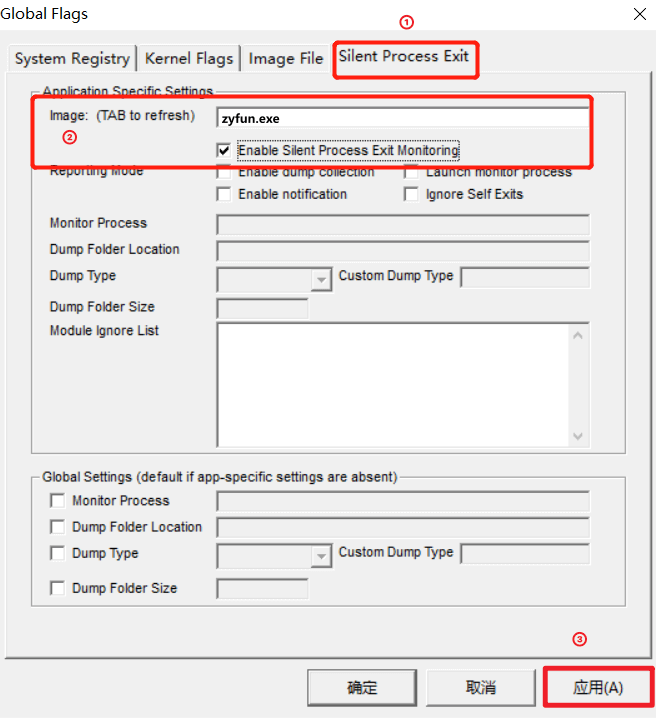
Start the software before setting image.
Silent Process Exit -> image(Enter the process name. Press tab to take effect.) -> Enable Silent Process Exit Monitoring(Check Process Listening) -> Apply
Normal reproduction of faults is sufficient here, no special requirements.
win + r type eventvwr.msc to open Event Viewer.Event Viewer -> Windows Logs -> Applications.windows has analyzed it for you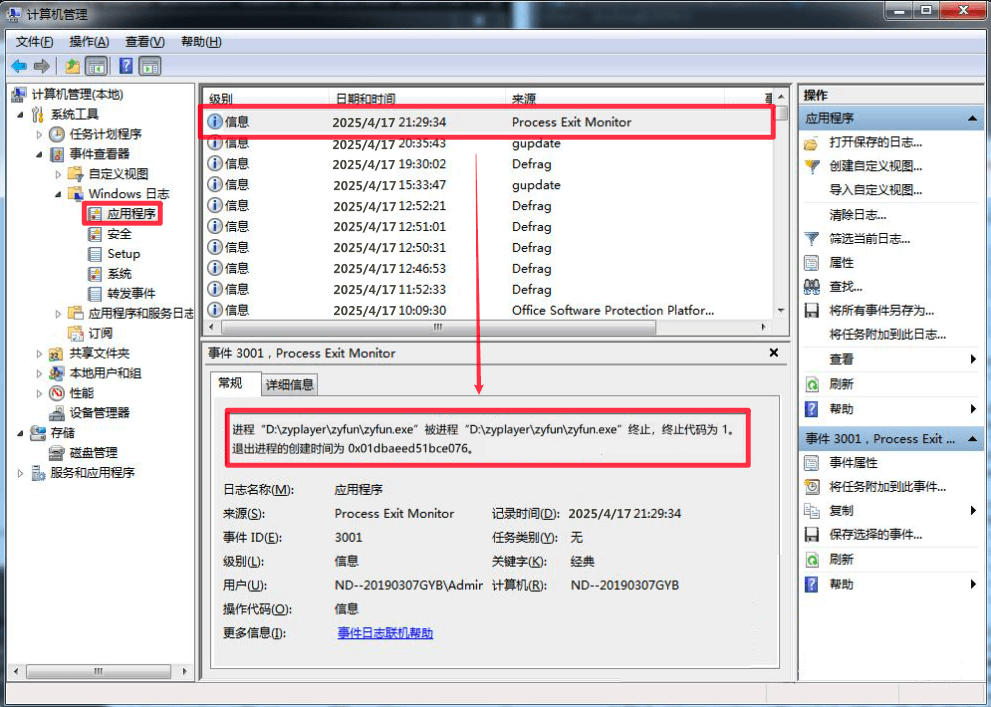
With the help of the tools
HRSword
HRSword 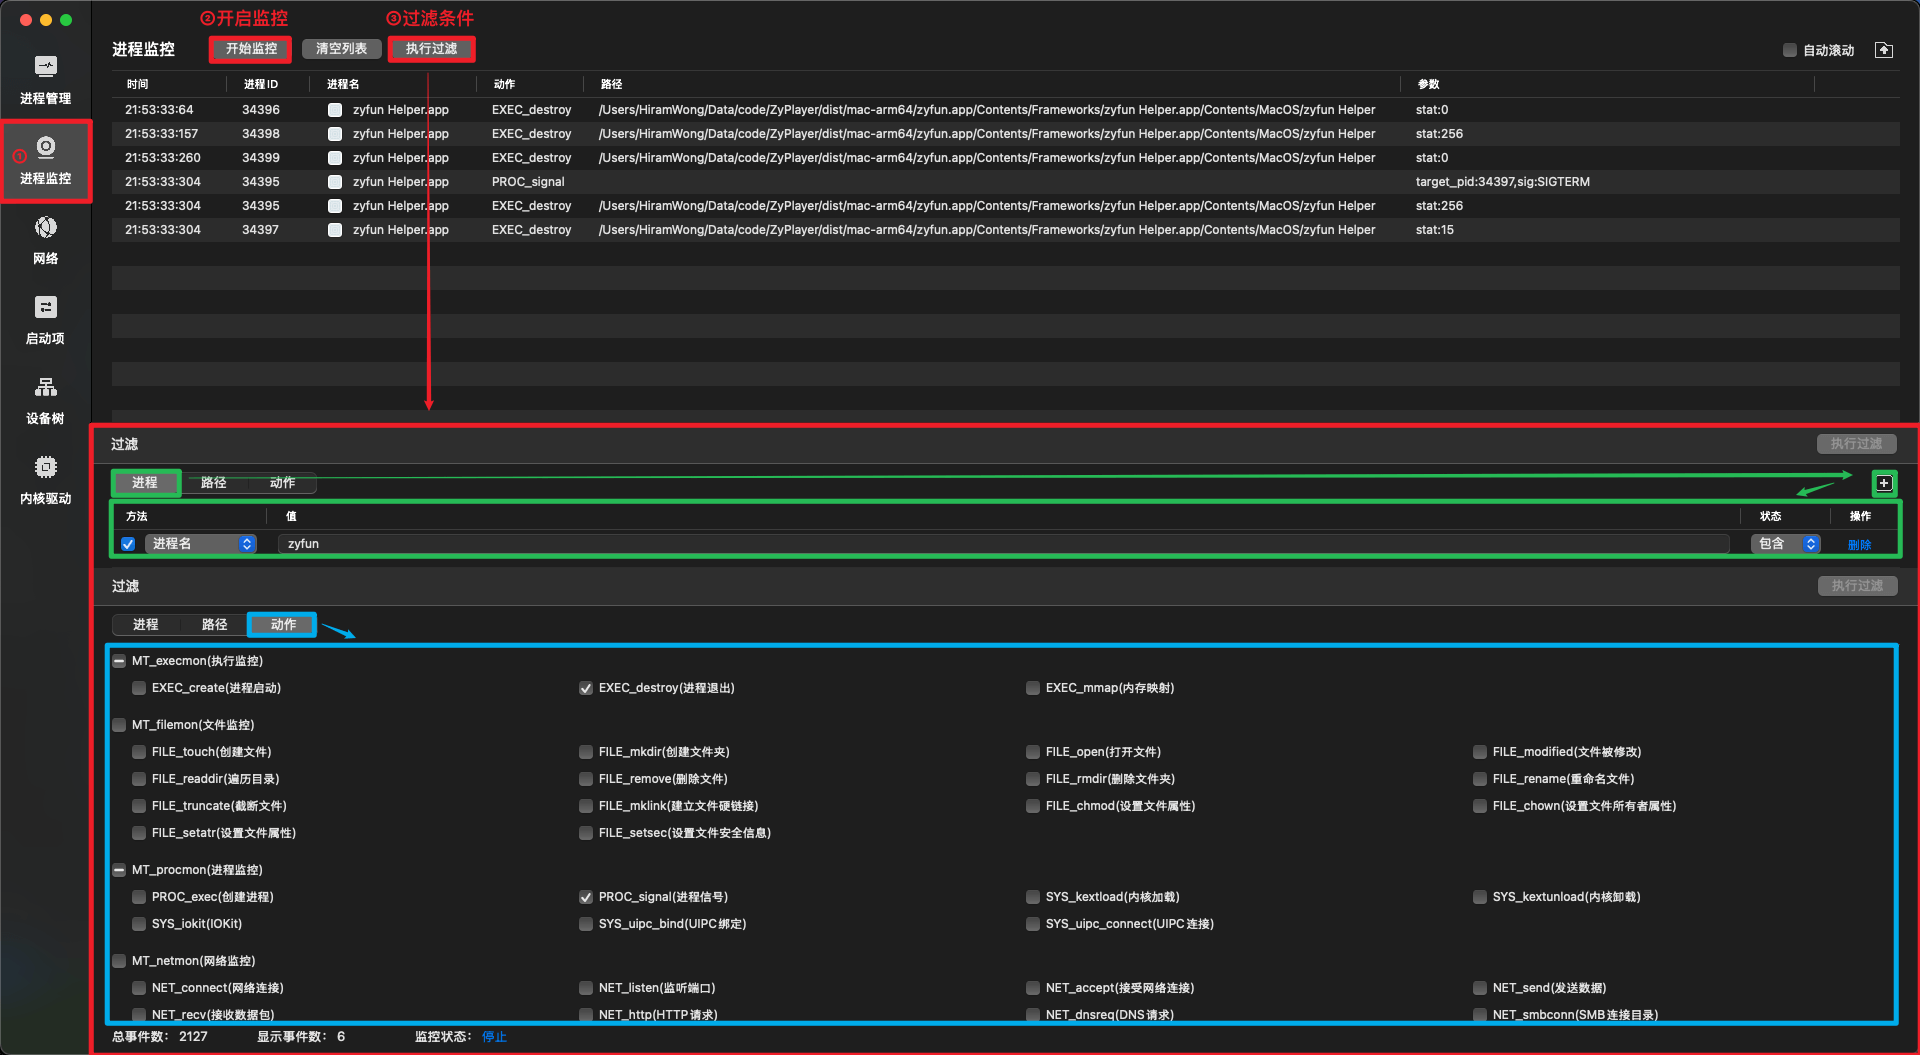
Normal reproduction of faults is sufficient here, no special requirements.
Process ID 34395 sends a SIGTERM signal (termination signal) to target process ID 34397
This indicates that process 34397 was explicitly terminated by process 34395, whose exit status code was stat:15, which is consistent with the expected behavior of the SIGTERM signal

Conclusion: The sub-process was killed by the software itself, and the cause should be investigated from the software itself.With the help of the tools
audit
audit On Debian|Ubuntu based systems (e.g. UOS|Kylin)
sudo apt update
sudo apt install auditd
On Euler|Anolis based systems
sudo yum update
sudo yum install audit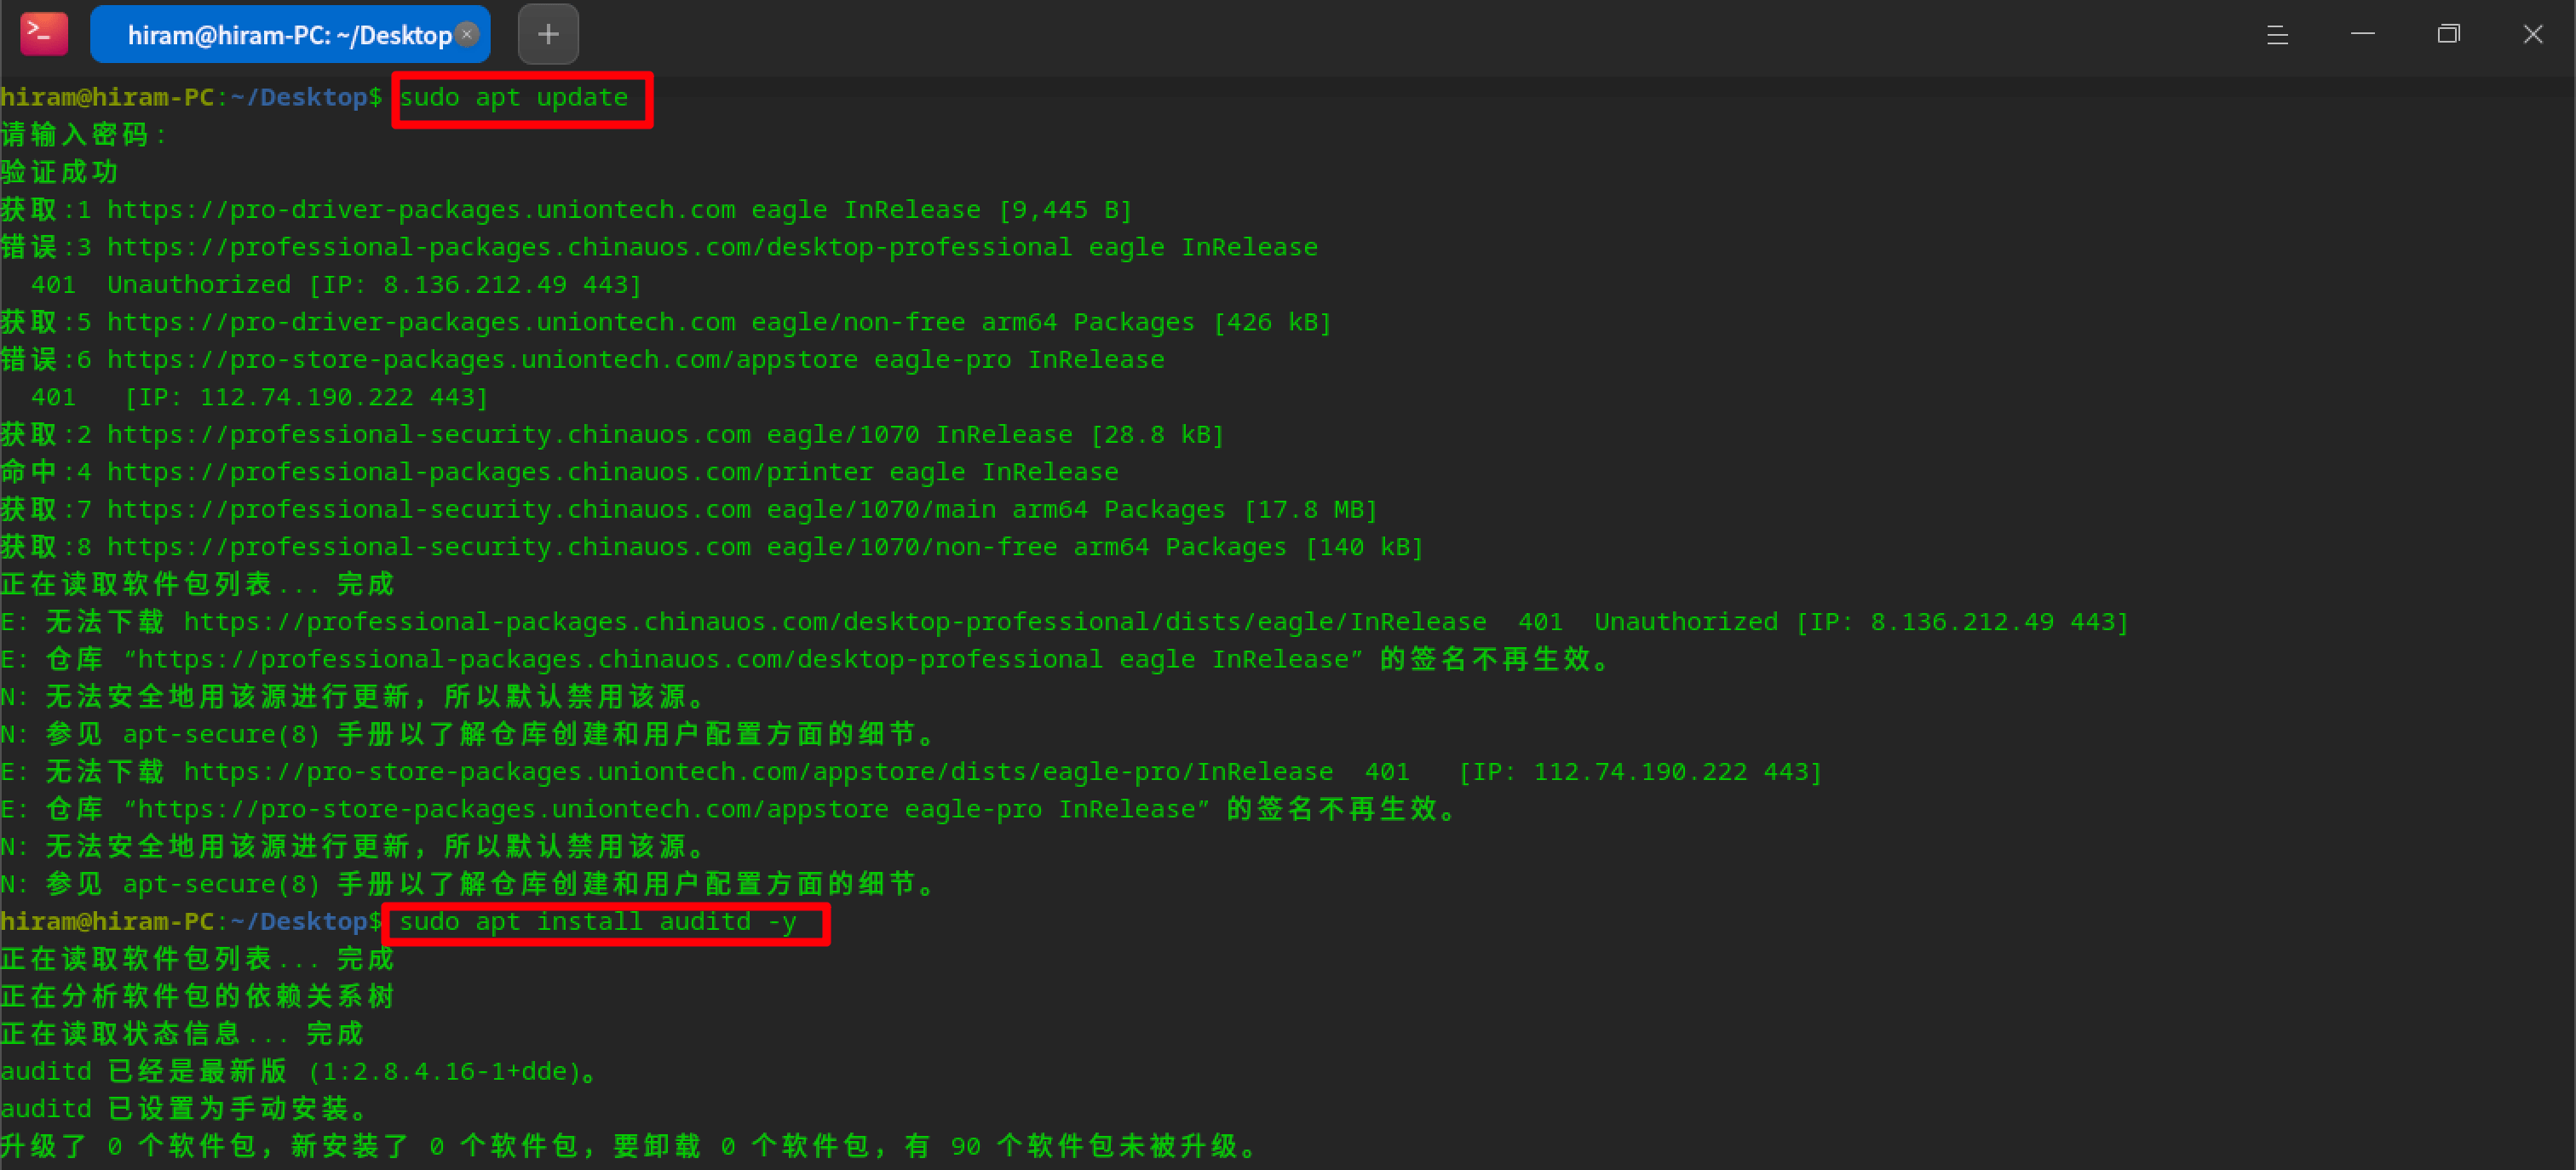
audit sudo systemctl start auditd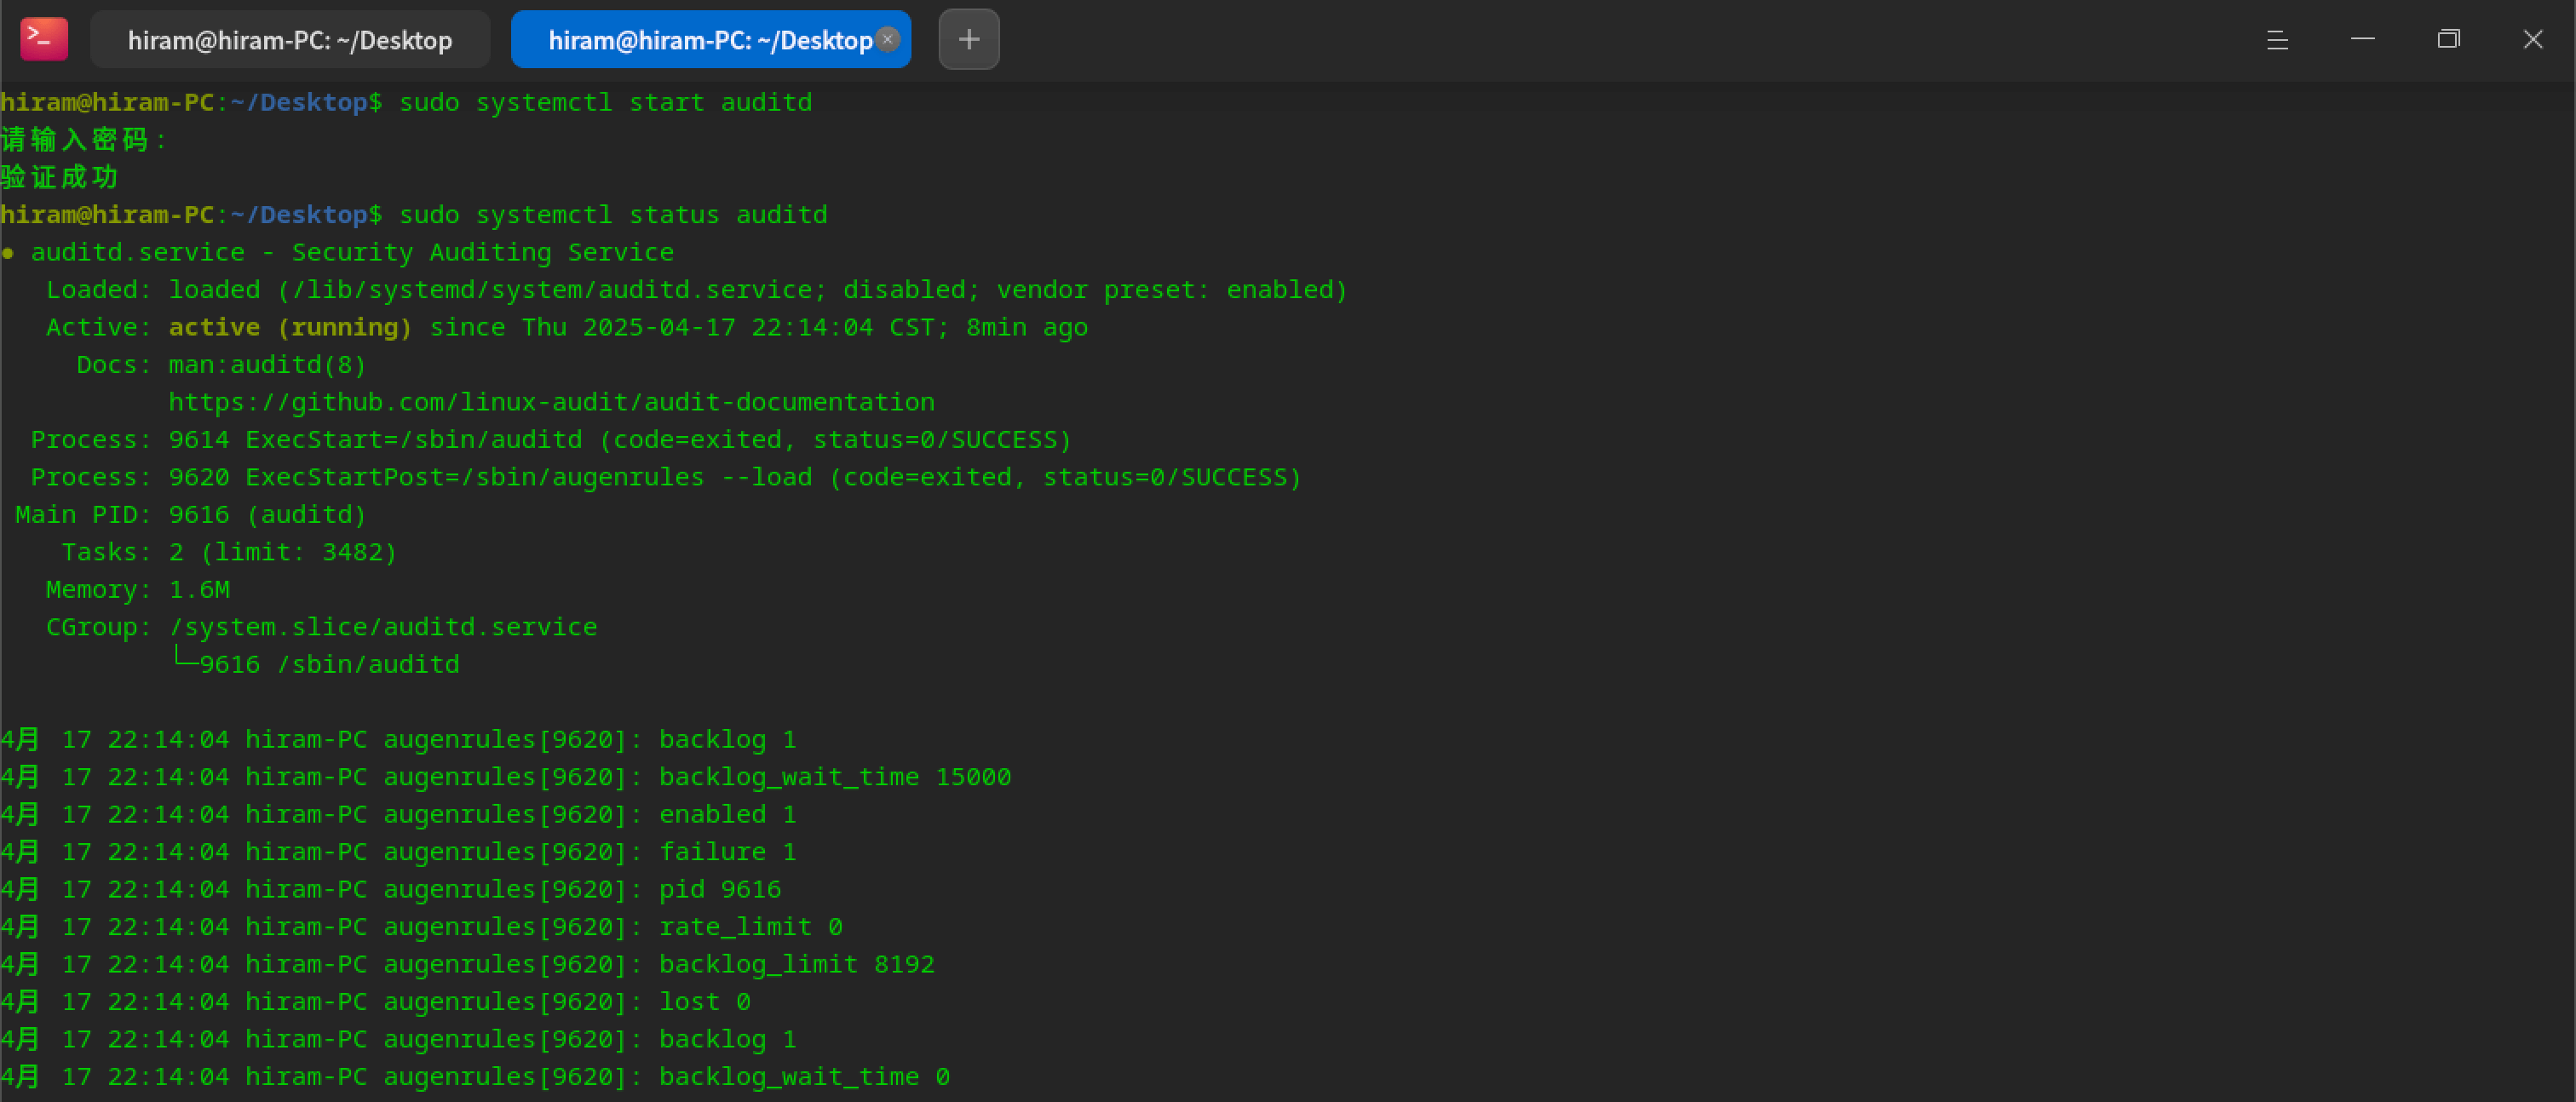
audit rule sudo auditctl -a exit,always -F arch=b64 -S kill -k zyfun_kill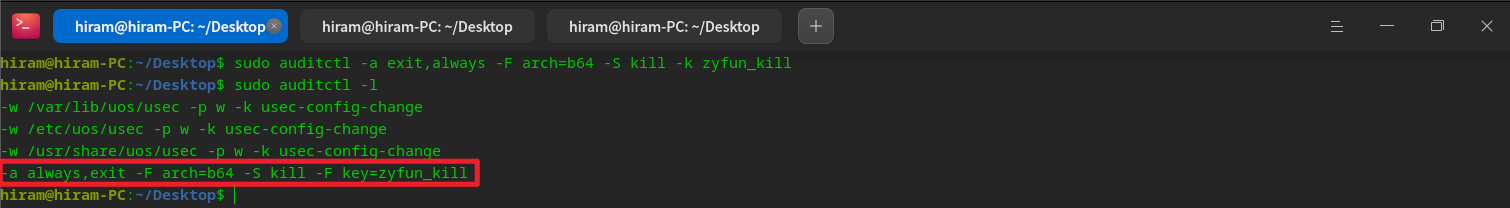
Normal reproduction of faults is sufficient here, no special requirements.
info
Use auditctl -h to view
sudo sudo ausearch -k zyfun_kill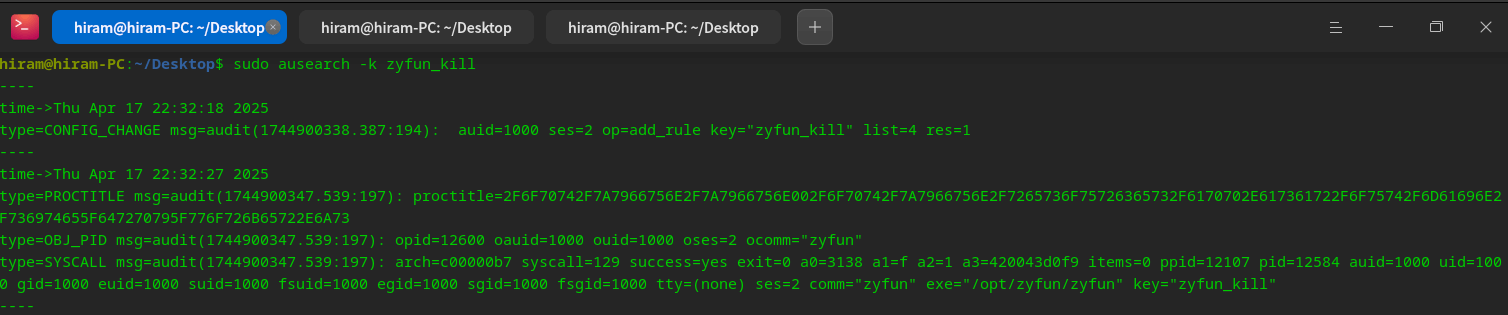
type=PROCTITLE msg=audit(1744900347.539:197): proctitle=2F6F70742F7A7966756E2F7A7966756E002F6F70742F7A7966756E2F7265736F75726365732F6170702E617361722F6F75742F6D61696E2F736974655F647270795F776F726B65722E6A73

type=PROCTITLE: Process title information
proctitle: Process command line arguments (in hex), decoded:`/opt/zyfun/zyfun /opt/zyfun/resources/app.asar/out/main/site_dropy_worker.js`type=OBJ_PID msg=audit(1744900347.539:197): opid=12600 oauid=1000 ouid=1000 oses=2 ocomm="zyfun"
type=OBJ_PID: 表示Information on the target process
opid=12600: PID of the target process: 12600
oauid=1000: Audit user ID (auidt) of the target process: 1000
ocomm="zyfun": Command name of the target process: zyfuntype=SYSCALL msg=audit(1744900347.539:197): arch=c00000b7 syscall=129 success=yes exit=0 a0=3138 a1=f a2=1 a3=420043d0f9 items=0 ppid=12107 pid=12584 auid=1000 uid=1000 gid=1000 euid=1000 suid=1000 fsuid=1000 egid=1000 sgid=1000 fsgid=1000 tty=(none) ses=2 comm="zyfun" exe="/opt/zyfun/zyfun" key="zyfun_kill"
type=SYSCALL:Indicates that this is a system call event
arch=c00000b7:Indicates that the architecture of the system call is 64-bit (b64)
syscall=129:indicates that the system call number is 129, which corresponds to the kill system call
success=yes:Indicates successful execution of the system call
exit=0:Indicates that the return value of the system call is 0, which means success
a0=3138:First parameter, the PID (opid) of the target process
a1=f:Second parameter, indicating the number of the signal to be sent (SIGTERM, value 15)
a2=1:The third parameter, indicating the source of the signal (1 means from user space)
comm="zyfun":The process that calls the kill system call is named zyfun
exe="/opt/zyfun/zyfun":Path to the executable that invokes the kill system call
key="zyfun_kill":This log matches the key you set zyfun_kill to1. The process was sent a SIGTERM signal
- syscall=129 means that this is a kill system call
- a1=f means that the signal number sent is 15, i.e. SIGTERM
- a0=3138 means the PID of the target process is 12600
2. The signal is sent by the process itself
- comm="zyfun" and exe="/opt/zyfun/zyfun" means that the process calling the kill system call is zyfun itself
- ppid=12107 and pid=12584 indicate the IDs of the parent process and the current process
Conclusion: The process was terminated by itself, not killed by other software (`need to find out why from the software itself`)A dmp file will be generated
google breakpad git clone https://chromium.googlesource.com/breakpad/breakpad
cd breakpad
./configure && make
make installinfo
symbols for the electron version of the application.symbols for your operating system.arm architecture - electron v37.1.0 version), download electron-v37.1.0-darwin-arm64-symbols.zip.yarn install minidumpinfo
logs/crash/)const path = require('node:path')
const minidump = require('minidump')
// https://github.com/electron/electron/releases
// The symbolPaths and file addresses need to be changed.
const symbolPaths =
'/Users/xxx/Downloads/electron-v37.1.0-darwin-arm64-symbols/breakpad_symbols'
const file =
'/Users/xxx/Library/Application Support/zyfun/log/crash/pending/a7c15378-df3d-4810-a832-50ba6ae95ad6.dmp'
minidump.walkStack(file, symbolPaths, (err, result) => {
if (err) {
console.error('Error reading minidump:', err)
return
}
fs.writeFileSync('dump.txt', result.toString())
})A dump.txt file is generated
# The path after node is changed to the name of the saved file.
node minidump_crash.jsminidumpStack information and reason will be generated (Crash reason field) 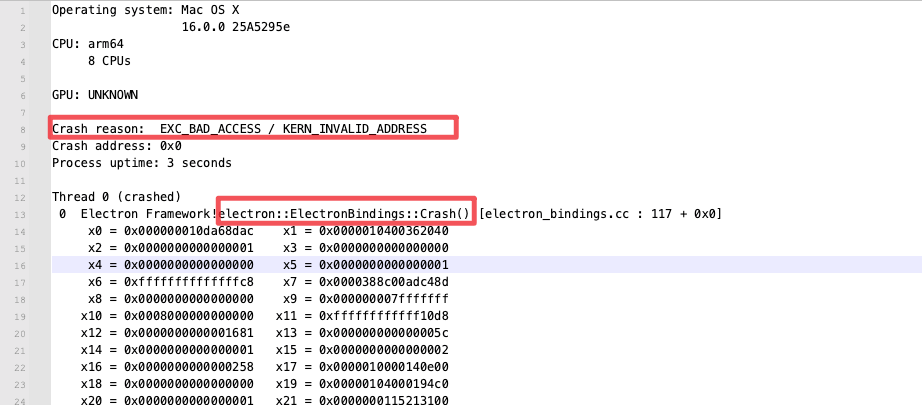 If you can't analyze it, just throw it to
 ai. 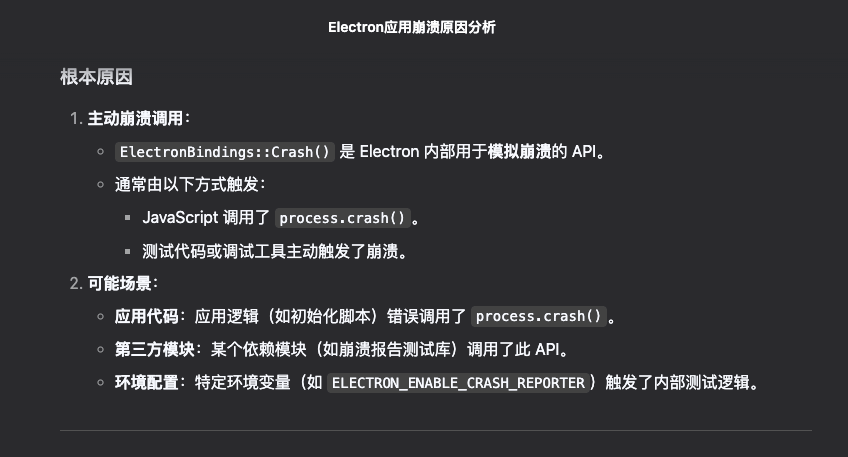 Check out the code (yes, that's me manually creating the runaround)
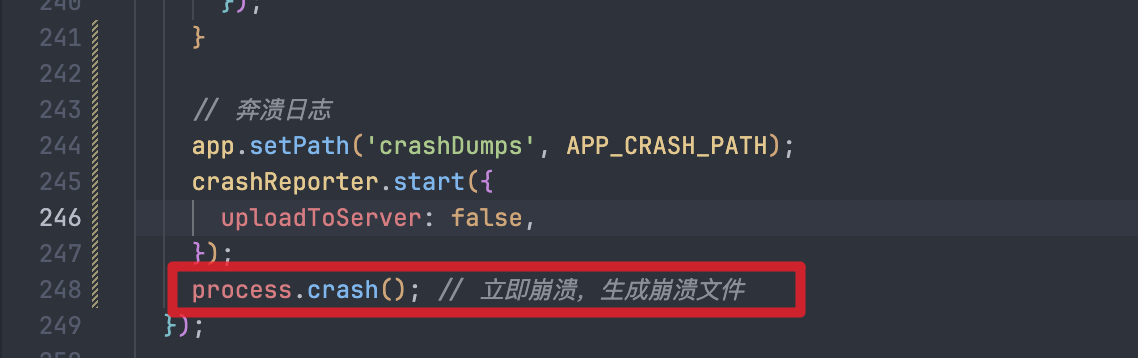
info
code:0 for success, others for failure.